Grapevine and Ozone: Uptake and Effects
by
 ,
,
Ivano Fumagalli
1, 
Stanislaw Cieslik
1,*,
Alessandra De Marco
2,
Chiara Proietti
3 and
Elena Paoletti
4 1
European Commission, Joint Research Centre, via E. Fermi 2749, I-21027 Ispra (VA), Italy
2
Italian National Agency for New Technologies, Energy and the Environment (ENEA), C.R. Casaccia, via Anguillarese 301, I-00123 S. Maria di Galeria, Italy
3
Italian Institute for Environmental Protection and Research (ISPRA), via Brancati 48, I-00144 Rome, Italy
4
Institute of Research on Terrestrial Ecosystems (IRET), National Research Council (CNR), via Madonna del Piano 10, I-50019 Sesto Fiorentino, Italy
*
Author to whom correspondence should be addressed.
Climate 2019, 7(12), 140; https://doi.org/10.3390/cli7120140
Submission received: 19 October 2019
/
Revised: 9 December 2019
/
Accepted: 10 December 2019
/
Published: 12 December 2019
(This article belongs to the Special Issue Air Pollution and Plant Ecosystems)
Abstract
:The grapevine (Vitis vinifera, L.) has been long since recognized as an ozone-sensitive plant. Ozone molecules can penetrate grapevine leaf tissues when the concentration of ozone in the atmosphere is high due to air pollution. This causes cell damage and interferes with photosynthetic mechanisms, subsequently slowing down plant growth and resulting in premature leaf senescence. Secondary effects include changes in biochemical processes that affect the chemical composition of the must and are likely to alter the quality of the wine. An experiment was conducted during two grapevine-growing seasons in 2010 and 2011 to gain knowledge of the effect of high ozone levels on the yield and on several biochemical characteristics of the plant which could influence the quality of the final product. These factors are economically important for agricultural production; this is especially true for Italy, which is one of the largest wine producers worldwide. The method used was a facility consisting of open top chambers operated at a vineyard in Angera (northern Italy). This facility permitted the study of the effects of different ozone levels. At the end of the experiment, the grapes were weighed and chemical analyses were carried out in order to understand the effects of ozone on the different characteristics of the grapes and on concentrations of several of its chemical substances. In particular, concentrations of yeast assimilable nitrogen, degrees Brix, pH, tartaric and malic acids, and polyphenols, including resveratrol, were considered, as these influence the quality of the wine. Parameters characterizing the different ozone levels were expressed in terms of ozone exposure (AOT40) and phytotoxic ozone dose (POD). The results showed that high ozone levels affect grapevine weight and thus its yield. In addition, the quality of the wine is affected by reductions of polyphenols which diminish the nutritional benefits of the product. In addition, these reductions cause the wine to have a more aggressive taste. These results emphasize the practical importance of the present study.
1. Introduction
Sensitivity of the grapevine (Vitis vinifera L.) to ozone has been known for a rather long time [1,2,3,4,5]; other authors [6,7] reported visible foliar injury in plants of V. vinifera grown on vineyards in Greece, Spain, and Italy. When the atmospheric concentration of ozone (O3) is high due to air pollution, ozone molecules penetrate grapevine leaf tissues through the stomata, causing cell damage and interfering with photosynthetic mechanisms, something which produces a subsequent slowing down of plant growth and premature leaf senescence in many plant species [6,8,9]. Secondary effects include changes in biochemical processes that affect the chemical composition of the must and which are likely to cause alterations in the quality of the wine produced [10].
The effects of ozone uptake by grapevines are part of the much wider problem of ozone damage to crops, which has been known about for a long time [11,12,13]. Reviews on this topic can be found in e.g., [14,15]. The latter author considers ozone to be the most important air pollutant in non-urban areas and concludes that it considerably affects ecosystems, whether natural or cultivated.
The way by which ozone damages vegetation is related to its oxidizing potential. After penetration through the stomata, ozone reaches the cell membranes and the apoplast, whose oxidation produces hydroxyl and peroxyradicals as well as hydrogen peroxide [16]. Alkenes are converted into aldehydes and peroxides [17]. All these oxidized molecules are known under the generic appellation of reactive oxygen species (ROS). Details on these mechanisms can be found in [18,19]. Cell death may occur as the ultimate consequence of these oxidation processes. Up to a certain point, detoxification processes, involving ascorbate and glutathione [20], can “clean” the cell from ozone attack. The detoxification capability is genetically controlled, meaning sensitivity of plants to ozone is strongly species- and even cultivar-dependent. The final result of the action of ozone on vegetation is the perturbation of photosynthesis, which leads in several cases to a reduction in growth rates. This can cause important losses of agricultural crop yields on a global scale [21,22], with consequences at economic and human levels. The uptake of ozone by vegetation also causes physiological perturbations to natural vegetation [23]. Other studies have analyzed the effects of ozone on natural biomass production [24,25,26,27].
Two approaches are usually followed for the assessment of O3 risk to crops: the concentration-based approach [28,29,30] and the flux-based approach [31]. The former estimates ozone risk to vegetation by calculating an exposure index named AOT40, which is defined as the accumulated hourly O3 concentration exceeding a threshold of 40 ppb that is summed up over a growing season. The latter approach is based on another index, the phytotoxic ozone dose with threshold y (PODy) (mmol.m−2), which is computed as the accumulated stomatal ozone flux and is similarly summed up over a growing season. The latter depends on plant phenology, solar irradiance, temperature, vapor pressure deficit, and soil moisture [32,33]. A critical review of these indices has been made by other authors [34].
To date, the metrics described above have been applied to V. vinifera in a few studies only [5,10,35]. In the latter work cited, the authors examined the possible effects of O3 on grape leaves under natural conditions in the Rijeka bay area (Croatia) using the AOT40 index. The effects of environmental factors associated with air pollution on grapevines have been investigated by [29,36], among others. These authors found adverse effects of high temperature and air pollution conditions on photosynthesis in Vitis vinifera (cv. Hongti). A reduced value of stomatal conductance and of net assimilation in two grapevine cultivars (Maturano and San Giuseppe) while these were fumigated with O3 was also found [37]. Furthermore, [10] studied the impact of stomatal uptake of ozone on the quality of must as well as fruit yield in pot-grown grapevine plants exposed to different O3 concentration levels. These authors found foliar damage as well as yield losses. These results were obtained in controlled experimental conditions that were not necessarily representative of grapevines growing on a vineyard.
The goal of the experiment described here was to study the possible effects that ozone uptake by grapevines could cause in natural conditions and when the plants are enclosed in open top chambers (OTCs). Determination of the chemical composition of the must as well as of the weight of the grapes, expressing their biomass production, was carried out. Inside the OTCs, the O3 concentration was controlled and reduced by filters. The campaigns were conducted in August-September 2010 and in May-September 2011 at a vineyard near the town of Angera, which is located in northern Italy.
In the following sections the experiment, including the measurement of ozone concentration and other relevant parameters, is described. Then, the determination of exposure and integrated ozone flux is explained, as well as the measurable effects of ozone on yields and on chemical contents of the must.
2. Materials and Methods
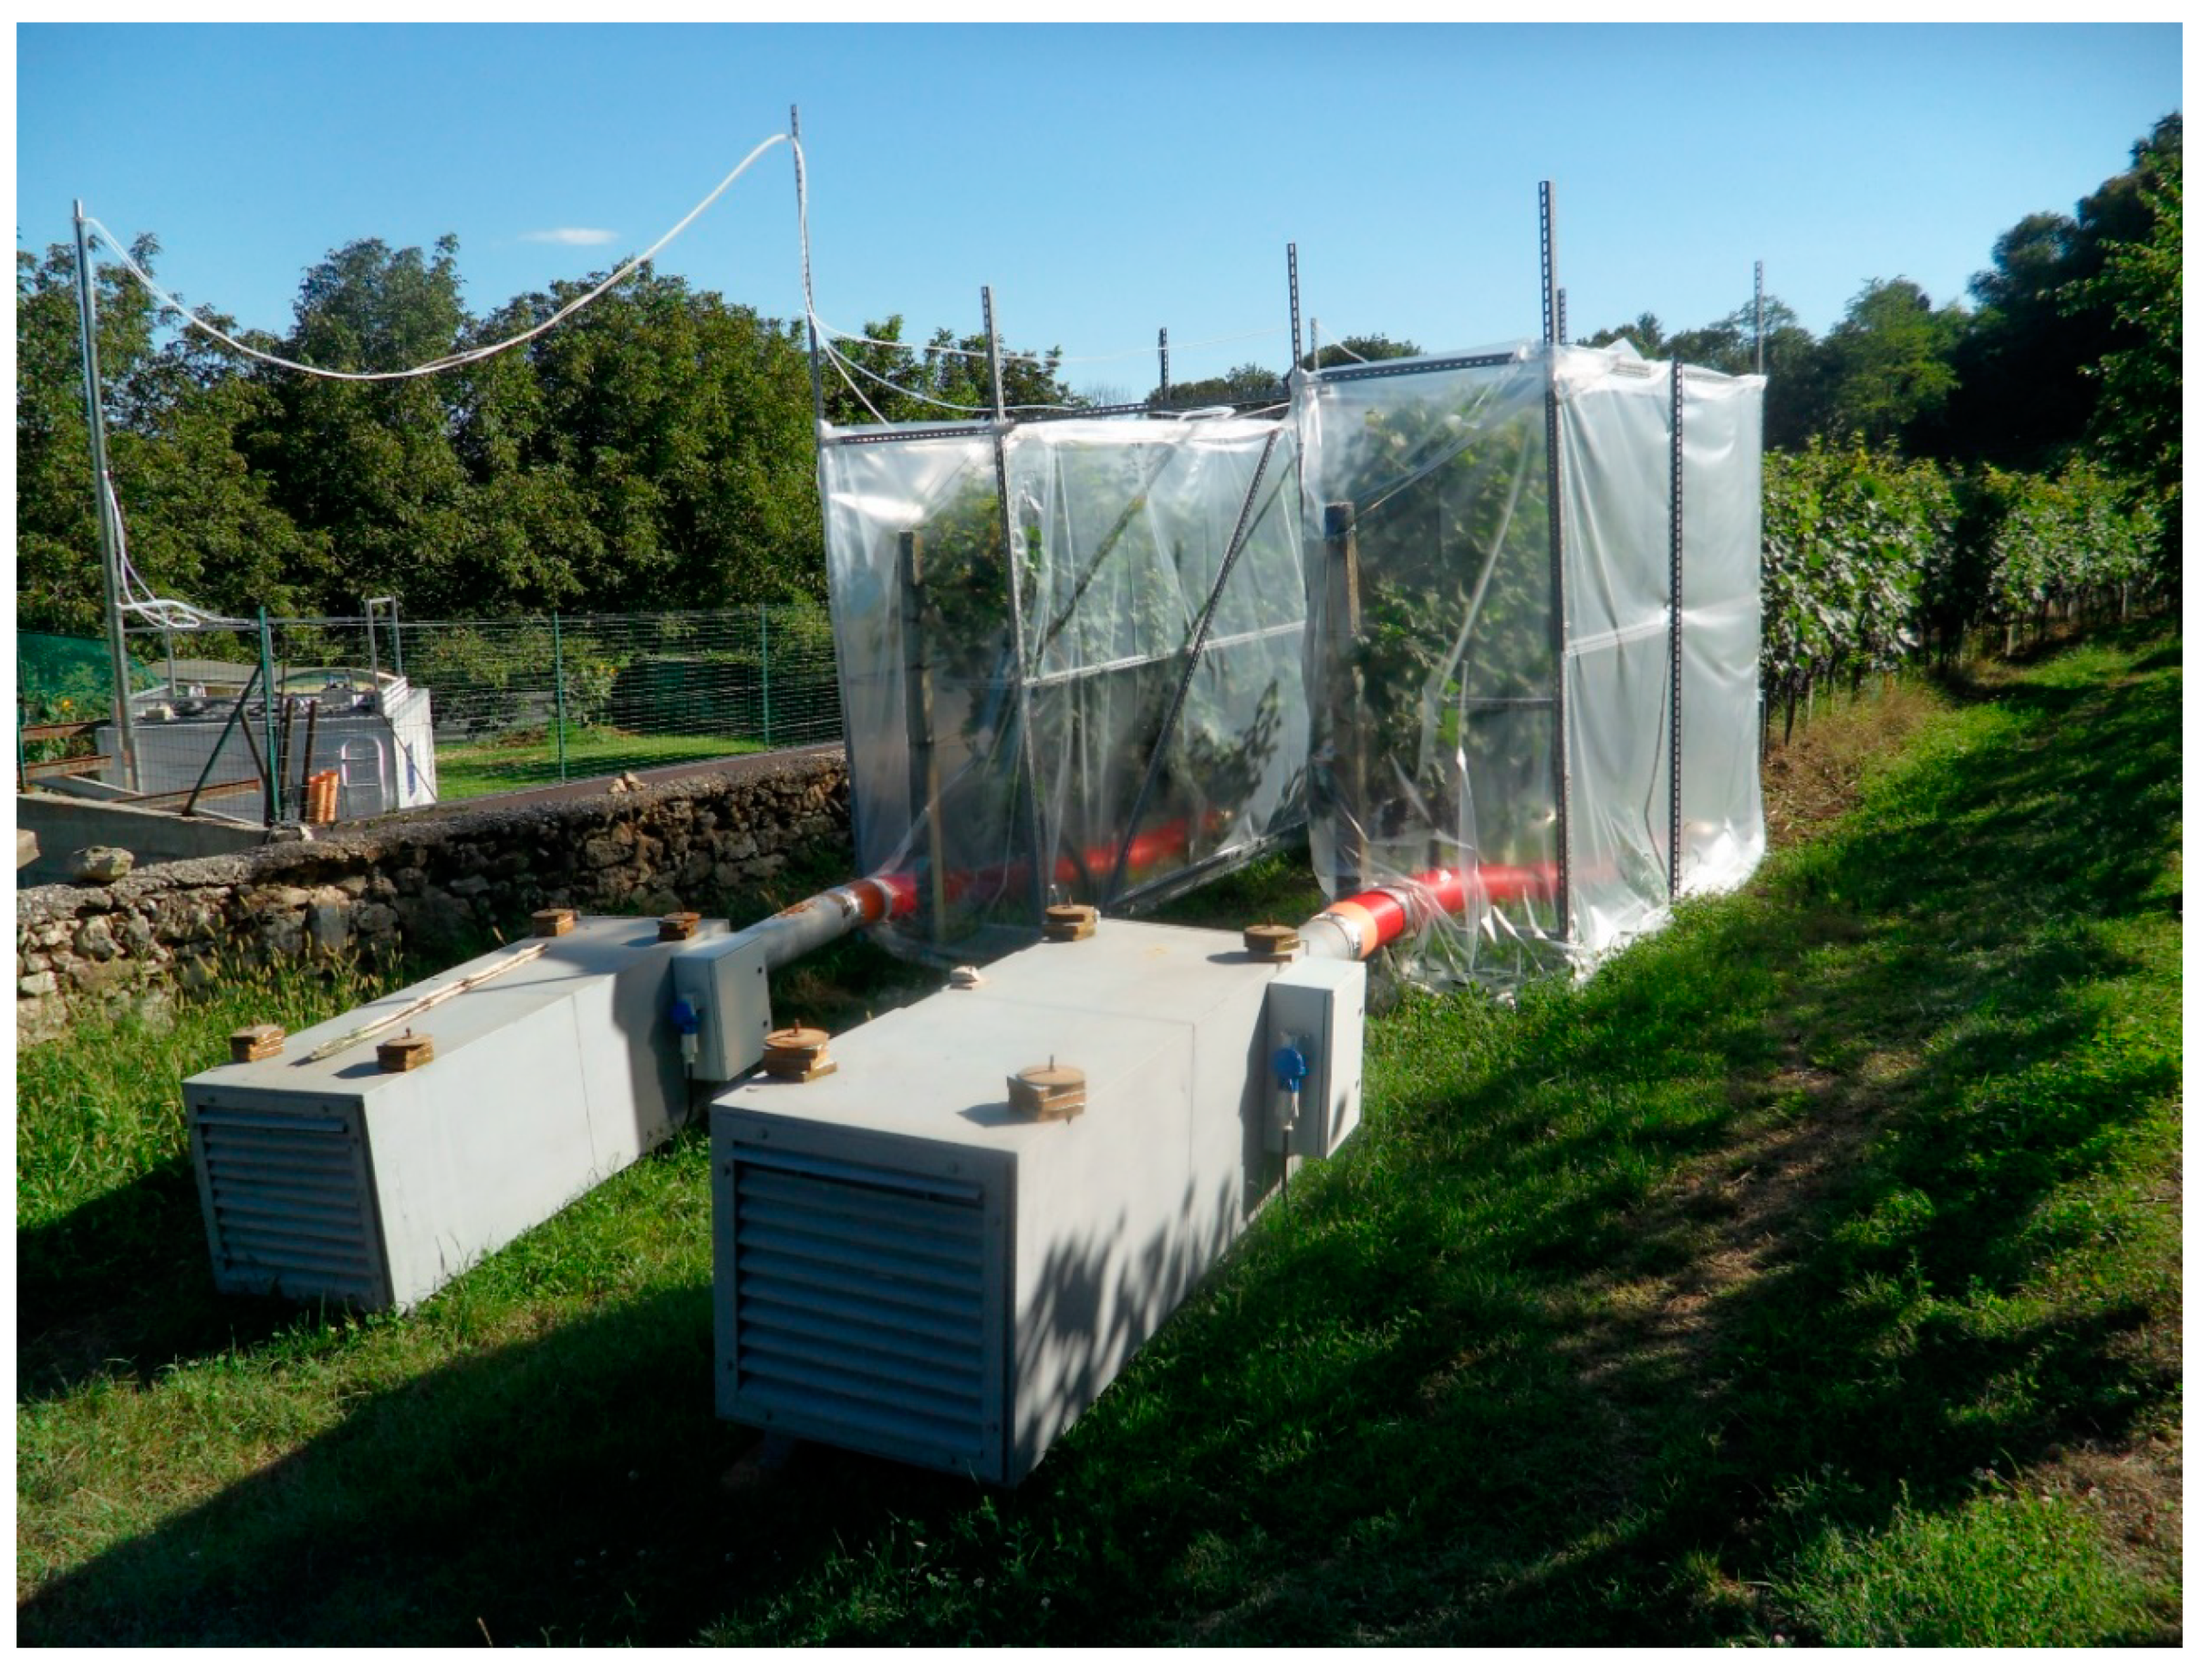
Four OTCs were operated on our chosen site (see Figure 1). Each OTC enclosed four grapevine plants (Vitis vinifera L., cv. Merlot). The size of each OTC was 0.8 m × 4.0 m × 2.5 m. Two OTCs were fed with ambient air and the two others with filtered air, from which a part of the ambient O3 was removed by a chemical substance (PURAFIL®, Doraville, GA, USA). It was deduced from the measurement of flow rates of the air pushed into the chambers (16 m3 min−1) and from the volume of the OTCs that air inside the OTCs was completely mixed and renewed in two minutes. Measurement of temperature and humidity at various points inside the OTCs led to the conclusion that these variables were spatially homogenous. Ozone concentrations were monitored inside and outside the chambers (both filtered and unfiltered OTCs) during the whole experiment by making use of an ozone analyzer (Thermo Environmental Instruments, Inc., mod. 49C, Waltham, MA, USA). The analyzer’s input line was connected with a three-way switching valve permitting alternation between three input lines, pumping air from the open air as well as from the filtered and unfiltered OTCs.
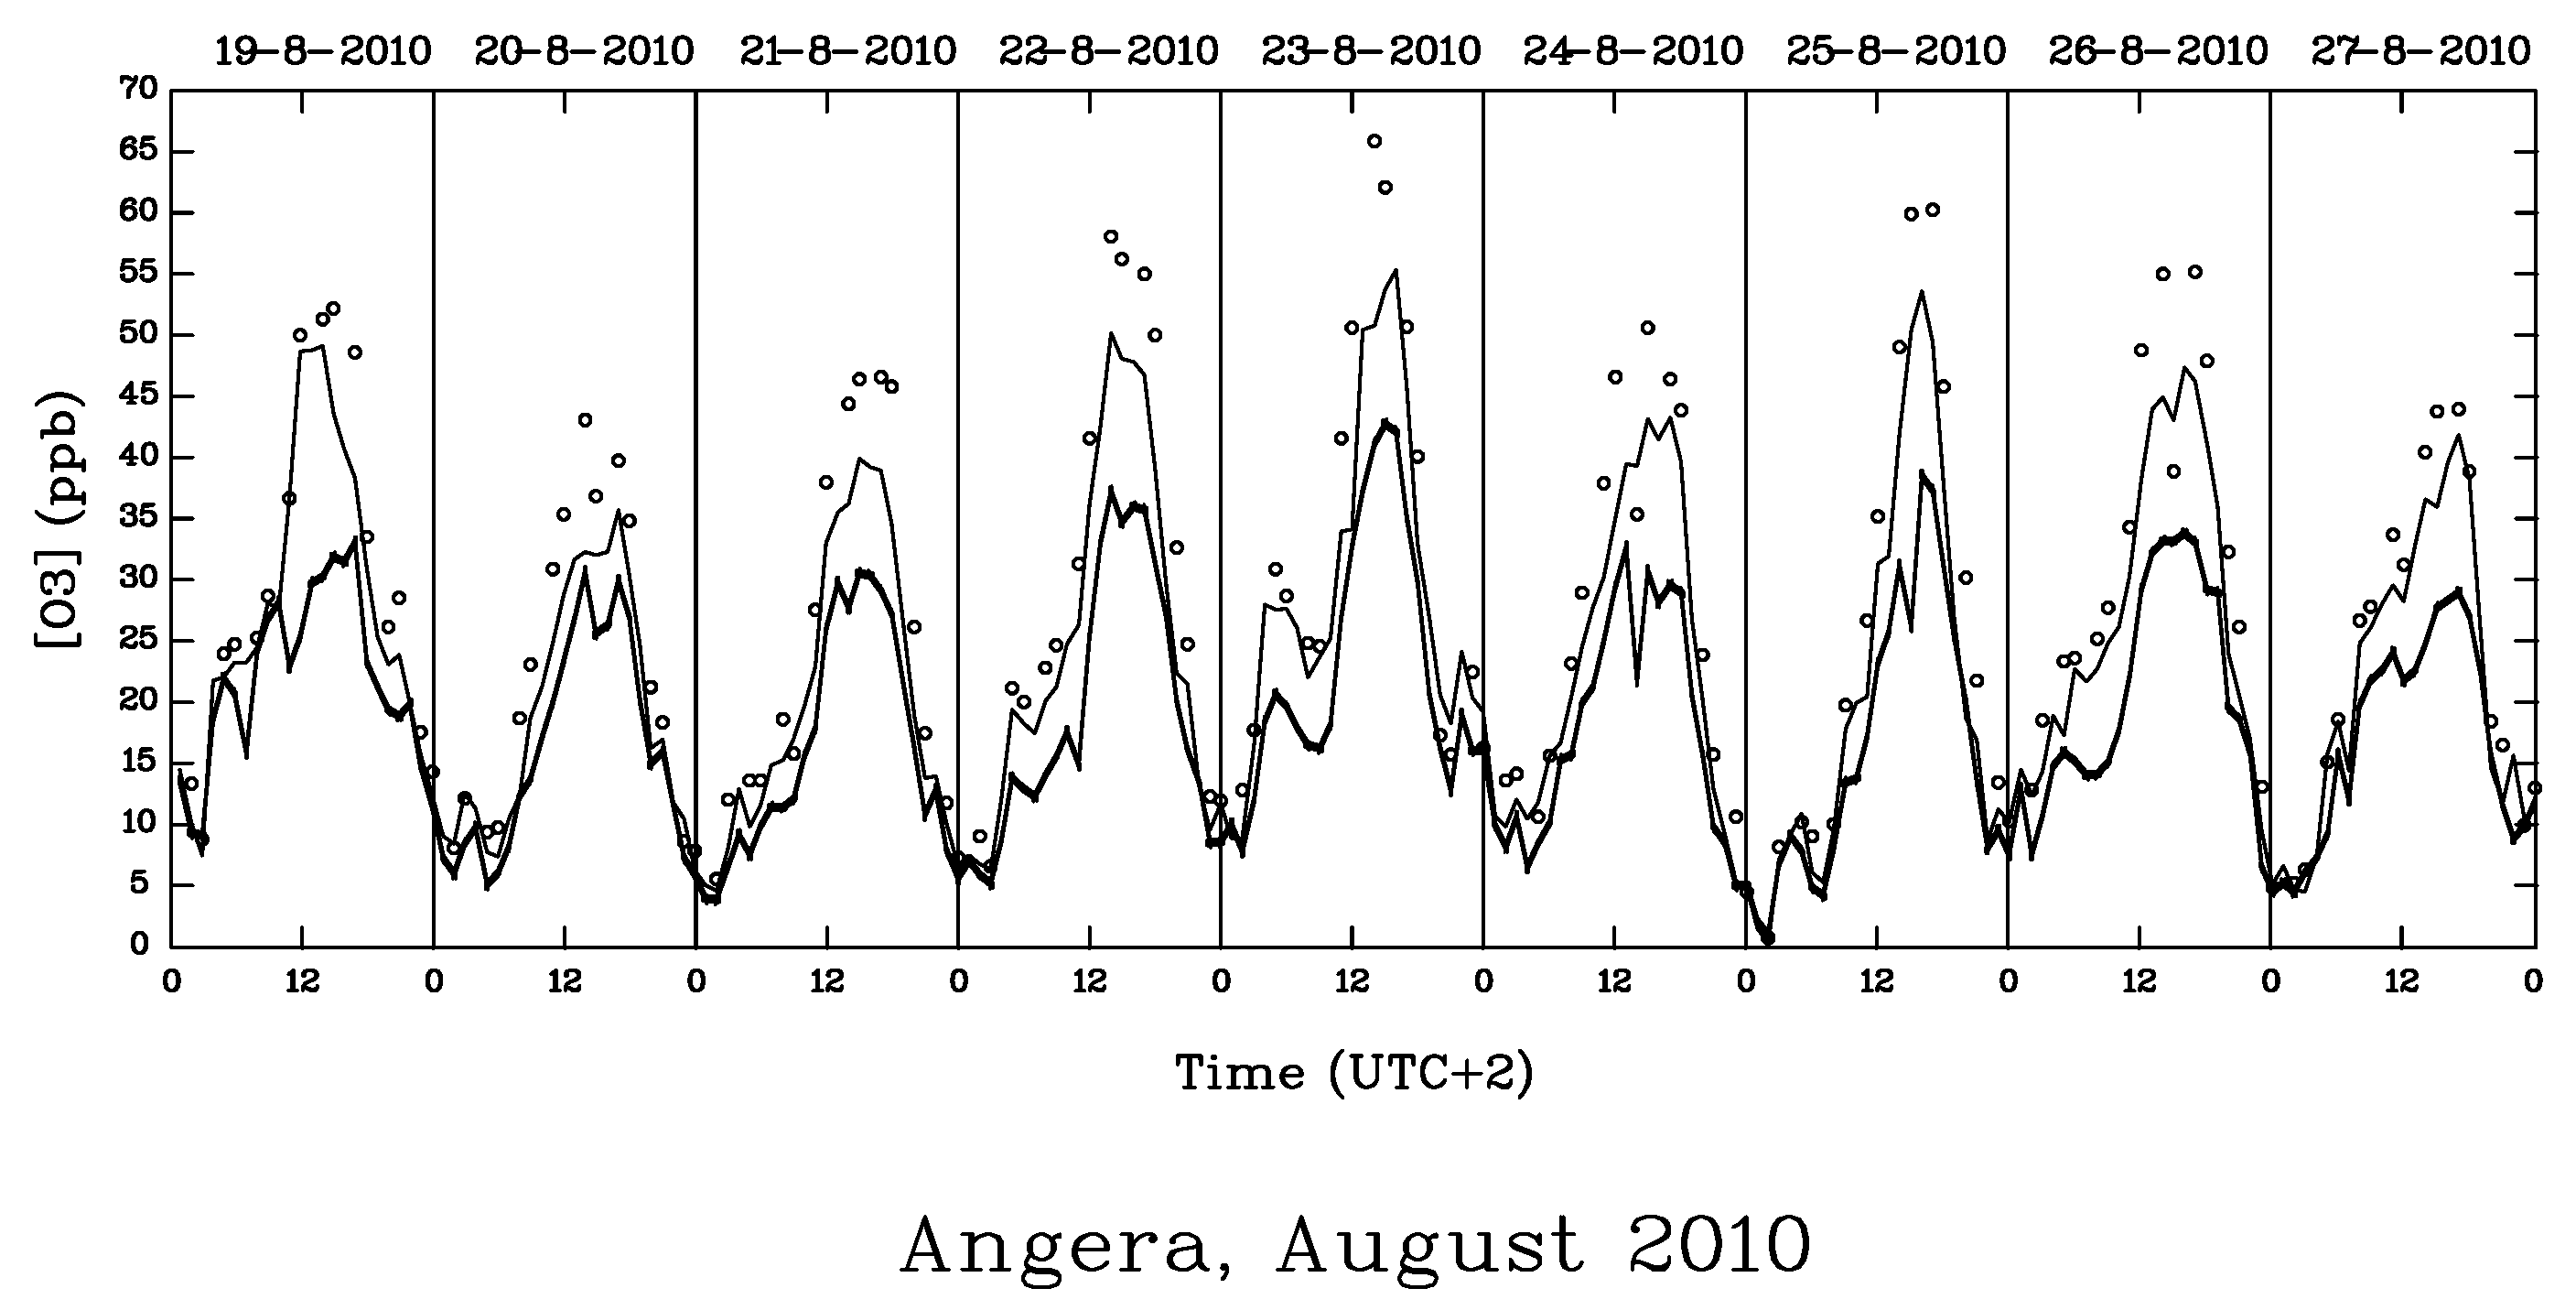
The first phase of the experiment was merely aimed at testing the capability of the experimental setup. This phase took place during the summer of 2010. During the initial period (5–11 August), the system was operated without eliminating ozone by filtering. The ozone concentrations recorded for the three lines (i.e., two pairs of OTCs and the external open air) are represented in Figure 2, and show good agreement between the lines. For the period covering 15 August to harvest time, filtering was introduced using PURAFIL®-filled filters, leading to the conclusion that absorption of ozone within the filters caused an around 30% reduction in the concentrations (Figure 3). An additional aspect to consider is the difference between open-air O3 concentrations and those measured inside the unfiltered chambers. This difference is related to a loss of ozone in the unfiltered OTCs due to its destruction on the tube walls.
During the year 2011, the complete growing season of grapevines was investigated. The experiment took place from June 2011 to harvest time, which occurred in September. In two chambers the air was filtered in order to reduce the O3 content. In each OTC, four plants were present. Since for each treatment (filtered and unfiltered) two OTCs were set up, each treatment consisted of eight plants. We also sampled eight plants for the open-air condition. Sampling was performed by randomly marking two bunches per plant at the beginning of the experiment (June 2011). These bunches were cut at harvest time (in September). However, at harvest, we had to eliminate a few plants because of damage by parasites or other causes like branches growing outside the OTCs. In the end, sampling included seven plants for the filtered OTCs, six plants for the unfiltered OTCs, and six plants for the external open-air plants. Bunches cut were weighed and then sent to the Istituto Agrario di San Michele all’Adige (Edmund Mach Foundation) for chemical analysis.
Chemical characteristics such as degrees Brix (an index quantifying the dissolved saccharose content of the must), pH, concentrations of tartaric and malic acids, potassium, and assimilable nitrogen were determined by FTIR. Total anthocyanins and polyphenols were determined using a method described by Mattivi [38]; resveratrol was determined by high performance liquid chromatography with a diode array detector [39].
ANOVA was used to statistically analyze the results obtained (see the Results section below).
3. Results
The main goal of the analysis was to determine whether grapes exposed to ozone-rich air (unfiltered OTC air and open air, i.e., air external to the OTCs) showed differences from grapes exposed to ozone-poor air (filtered OTC air) with regard to various parameters such as yield and chemical composition data.
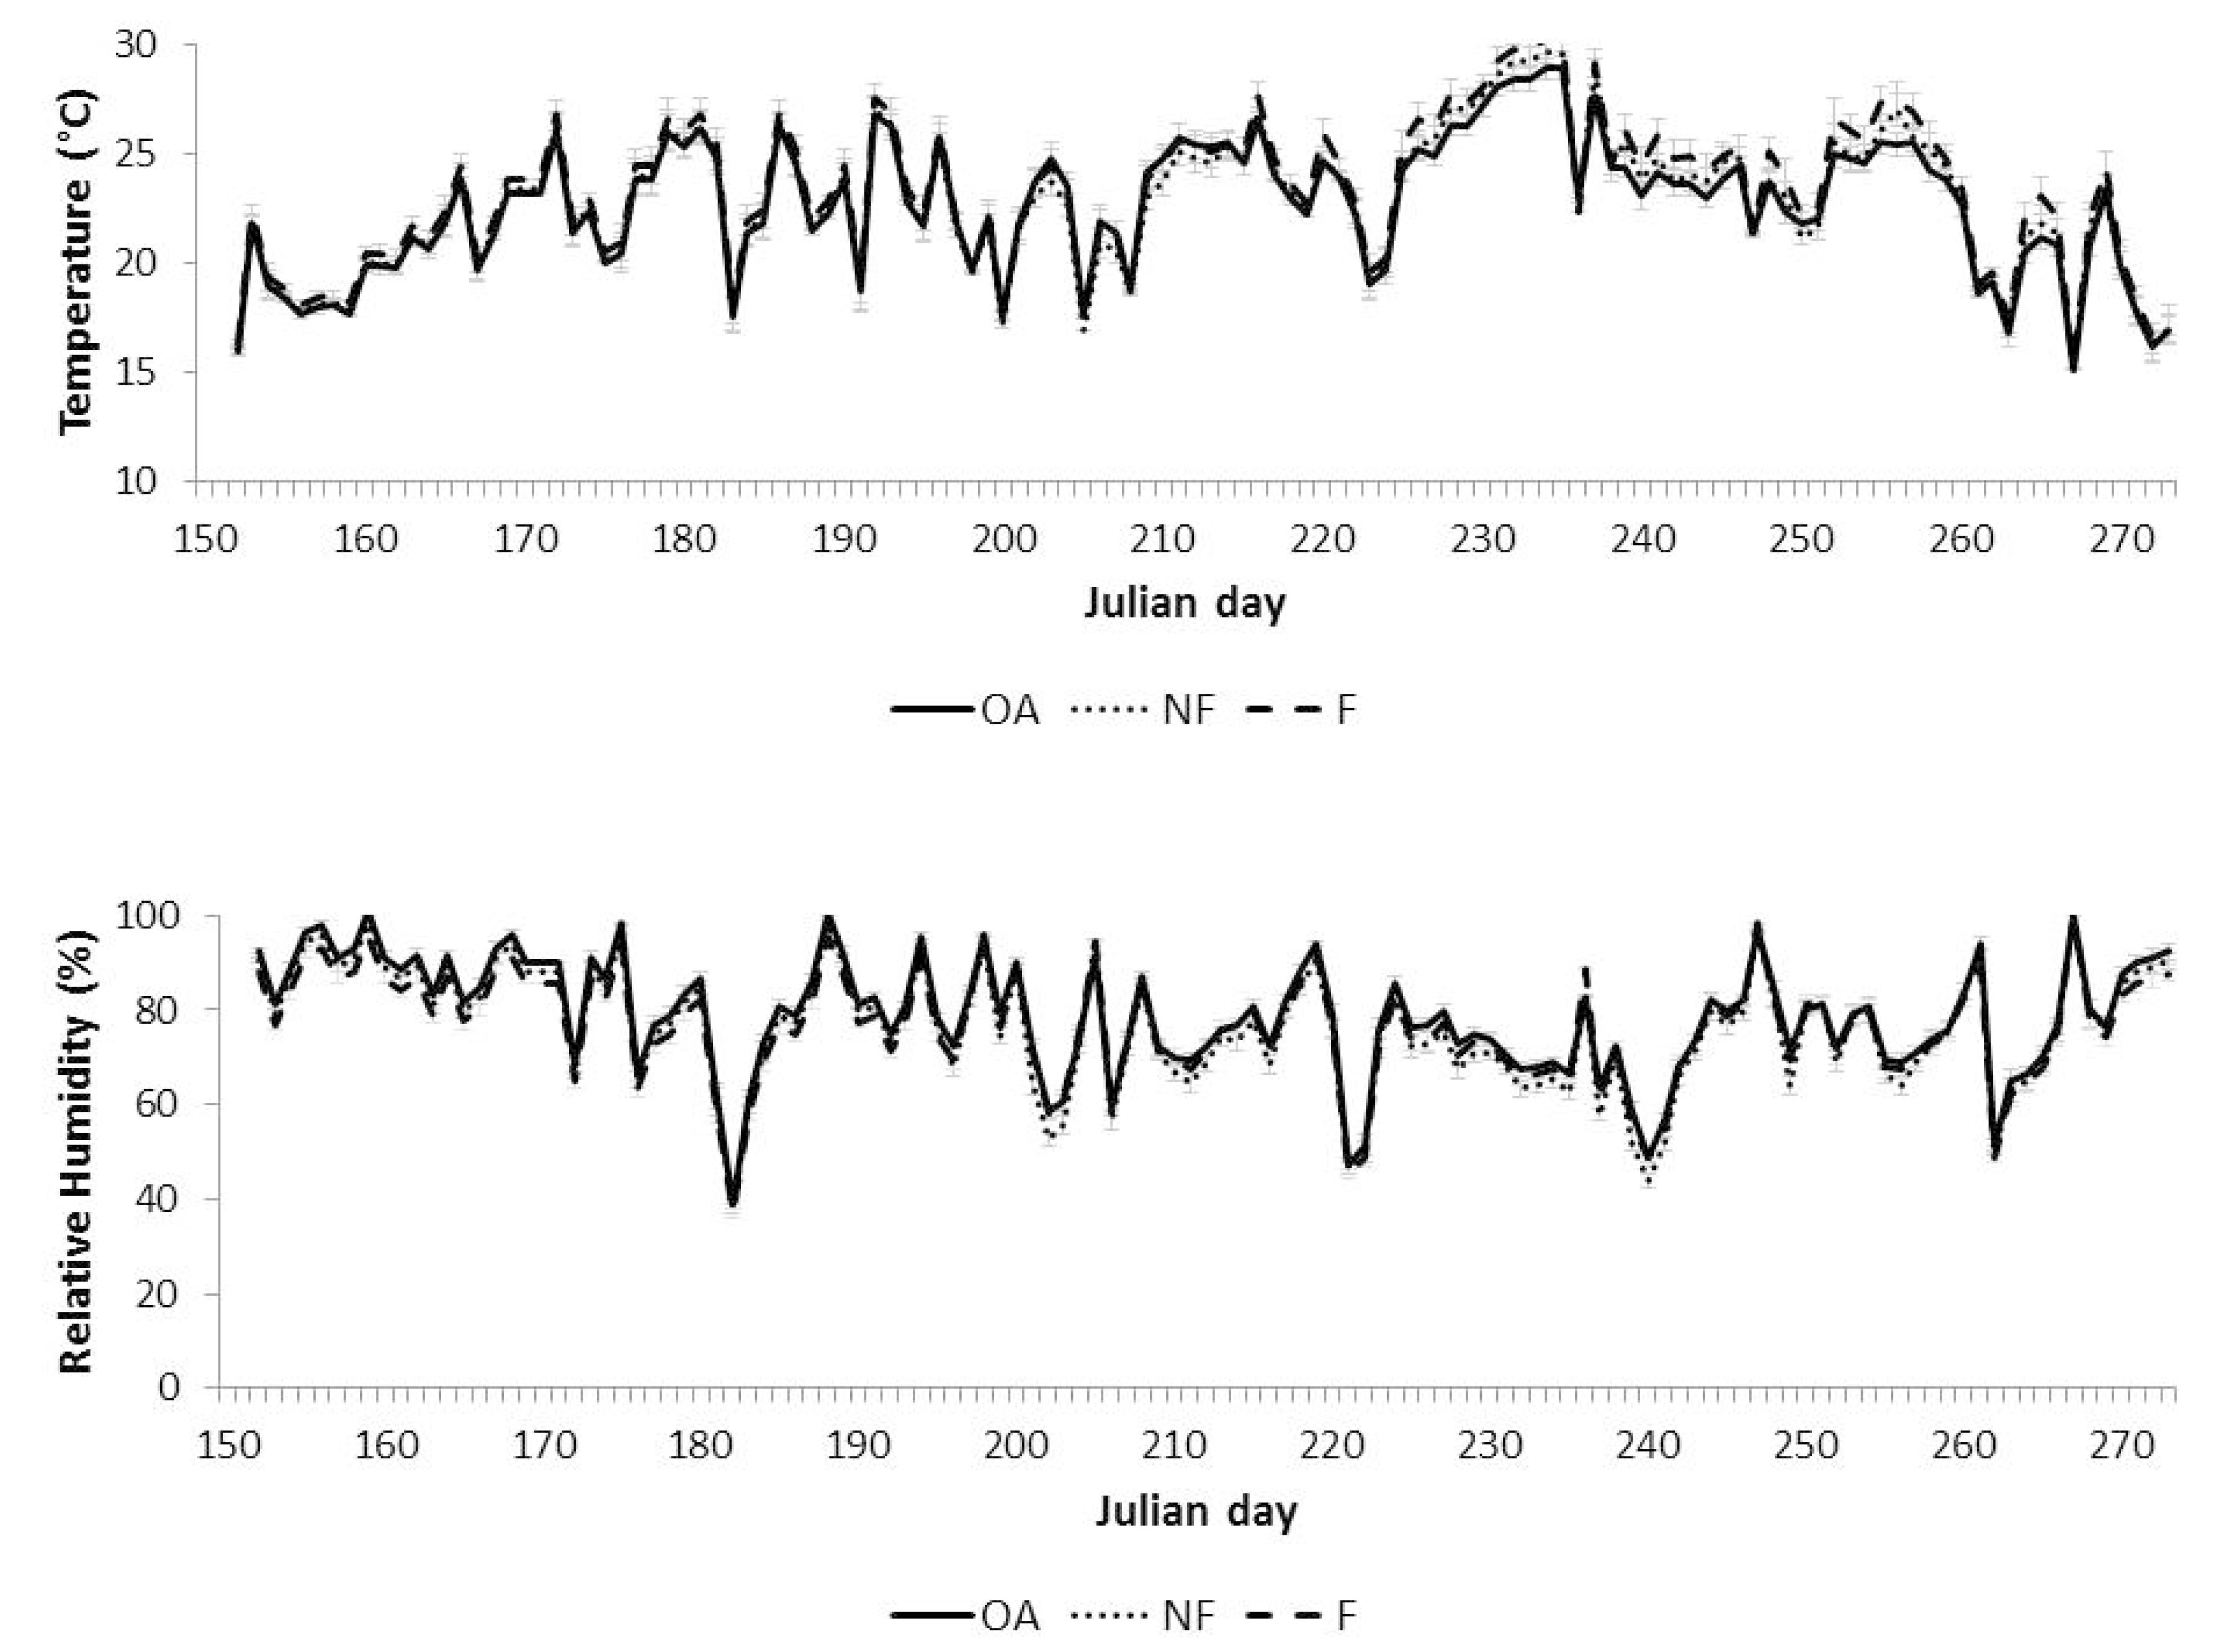
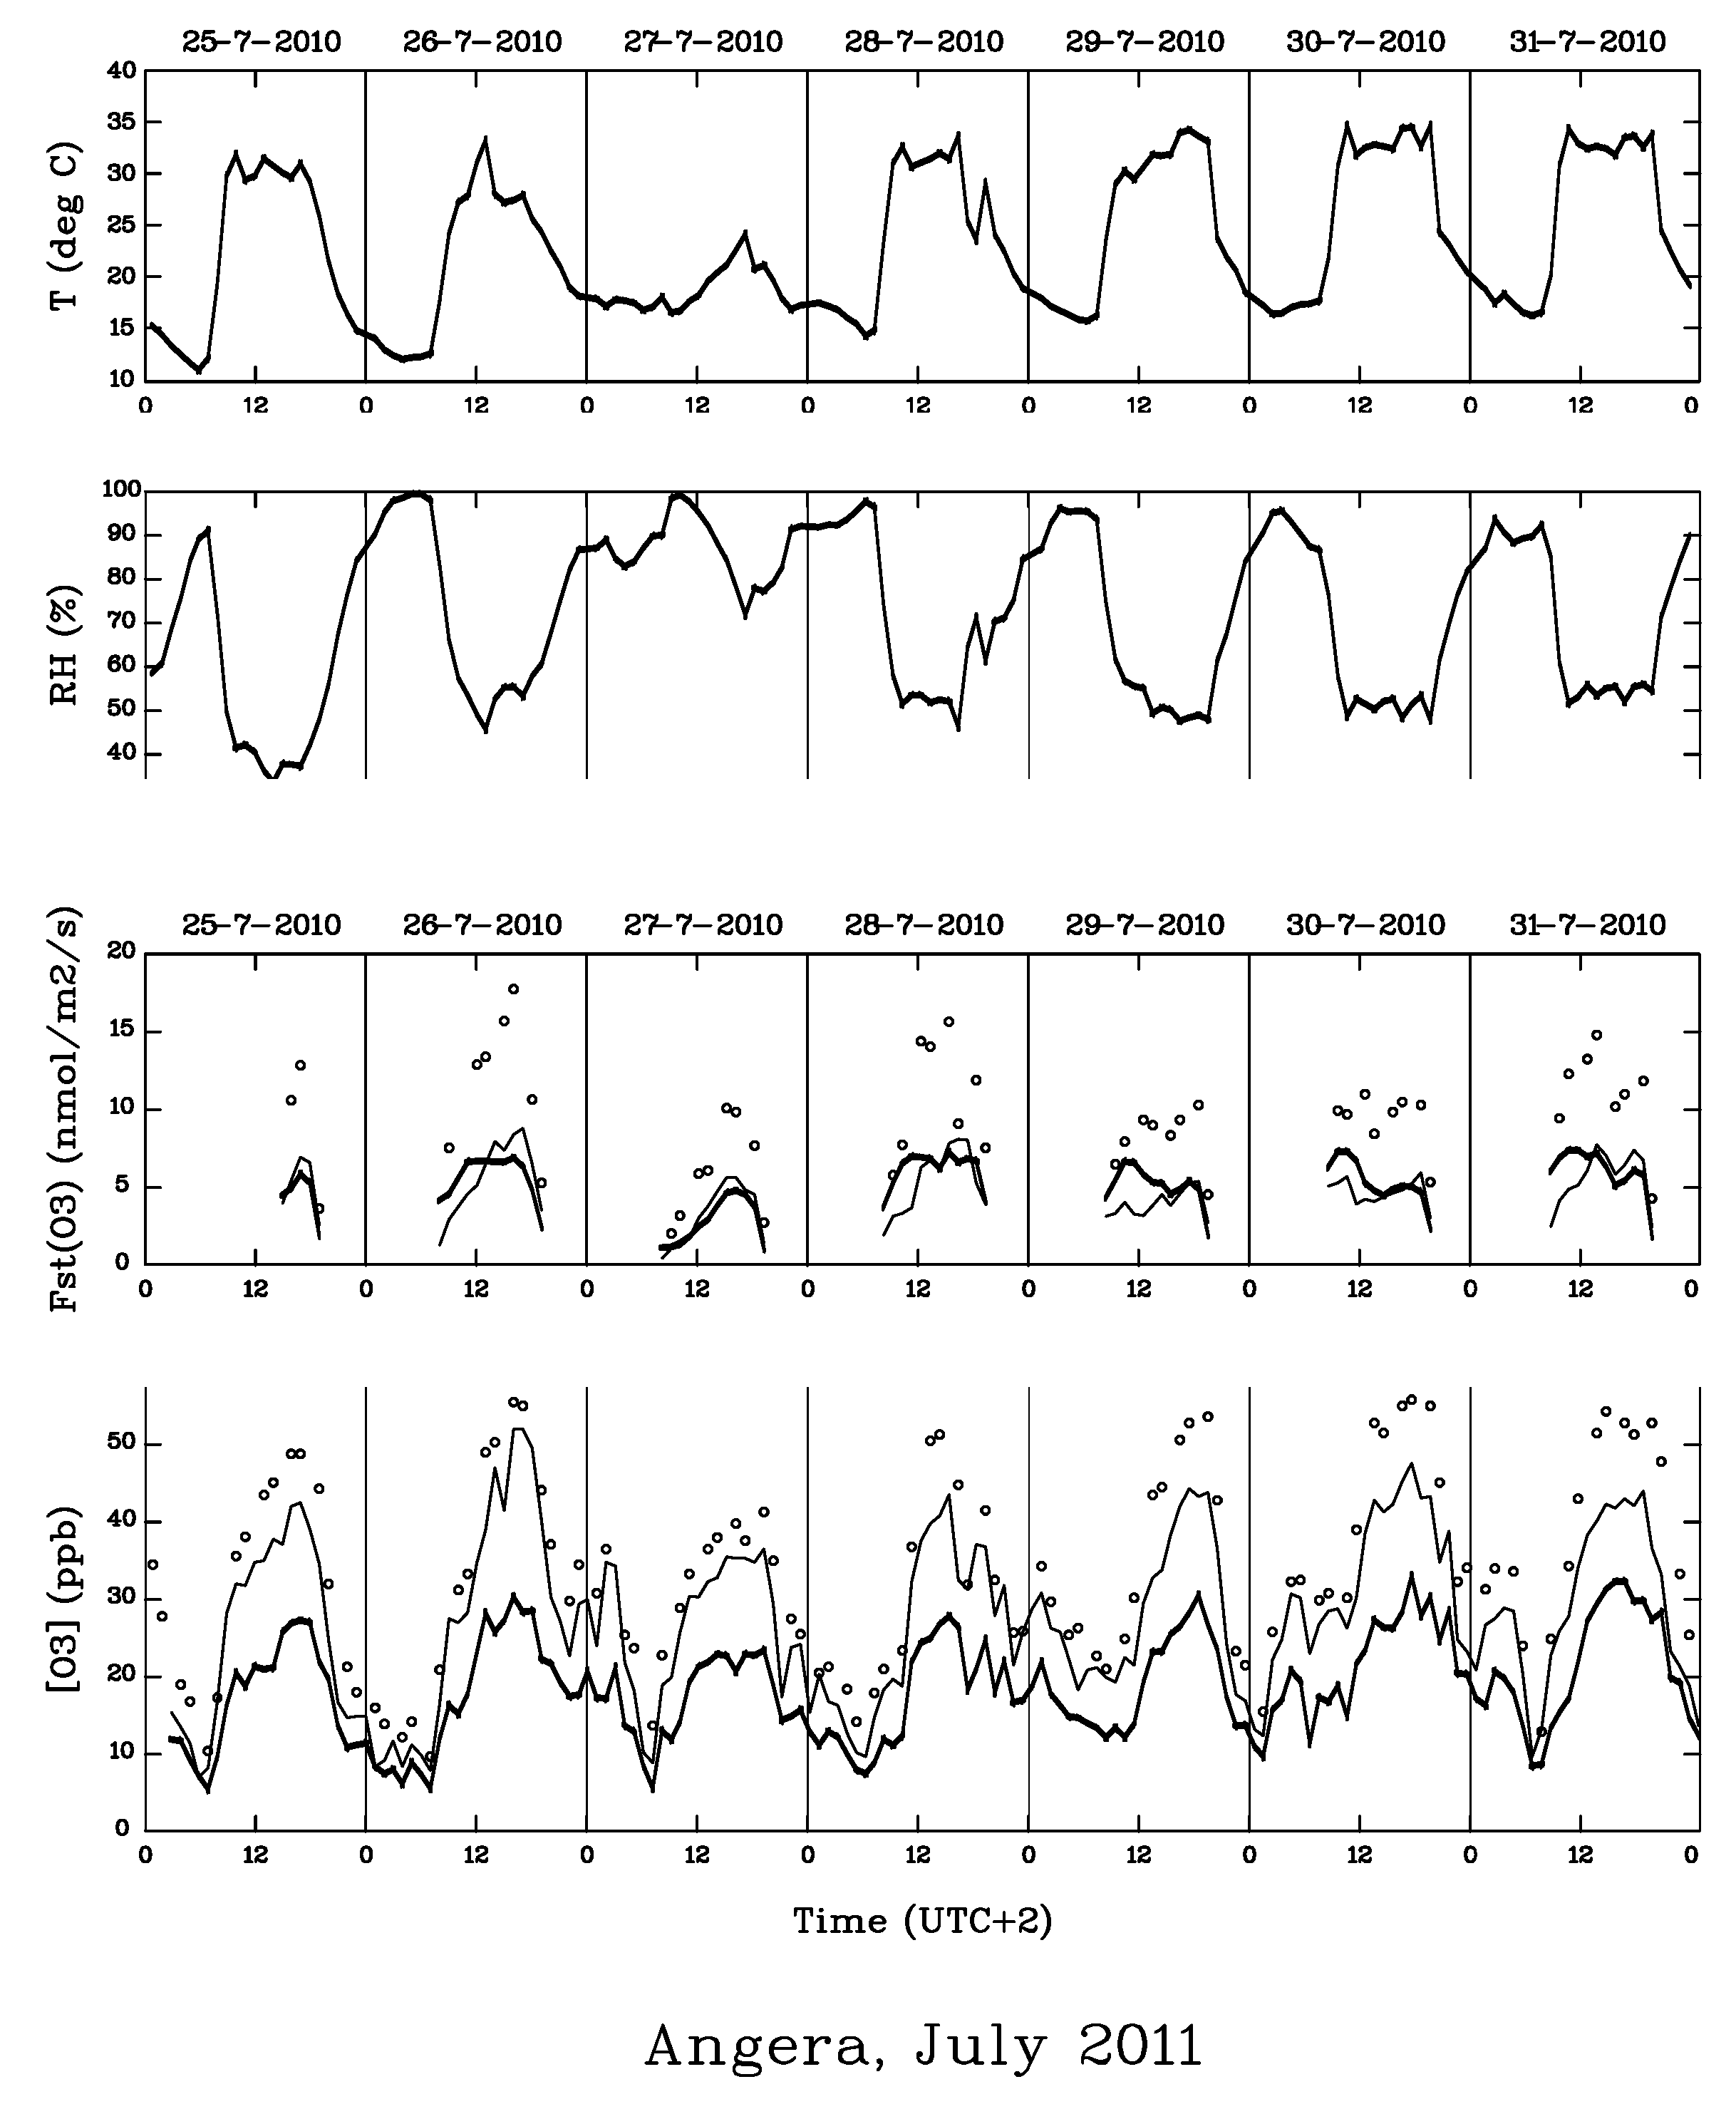
The experiments started in the beginning of June, during the summer of 2011. Ozone concentration, temperature, and relative humidity were monitored continuously until September when harvesting took place. The average temperature was 22.6 °C in the open air (OA), 23.3 °C in the filtered OTCs (F) and 22.7 °C in the unfiltered OTCs (NF). This indicates that the temperature differences were not critically important. As far as relative humidity (RH) was concerned, differences were higher between the OA and the air inside both kinds of OTCs. In the OA, the average RH was 78%, whereas in F and NF it was 76%. A more complete picture of temperature and humidity is shown in Figure 4. In parallel to the monitoring of concentrations, ozone stomatal fluxes were calculated by using the multiplicative DO3SE model (Deposition of Ozone for Stomatal Exchange) which was developed by several authors recently [32,33]. An example of a recorded time series is shown in Figure 5, where O3 concentration inside and outside the OTCs is represented, as well as temperature, relative humidity, and calculated stomatal O3 flux, for the period 25–31 July 2011.
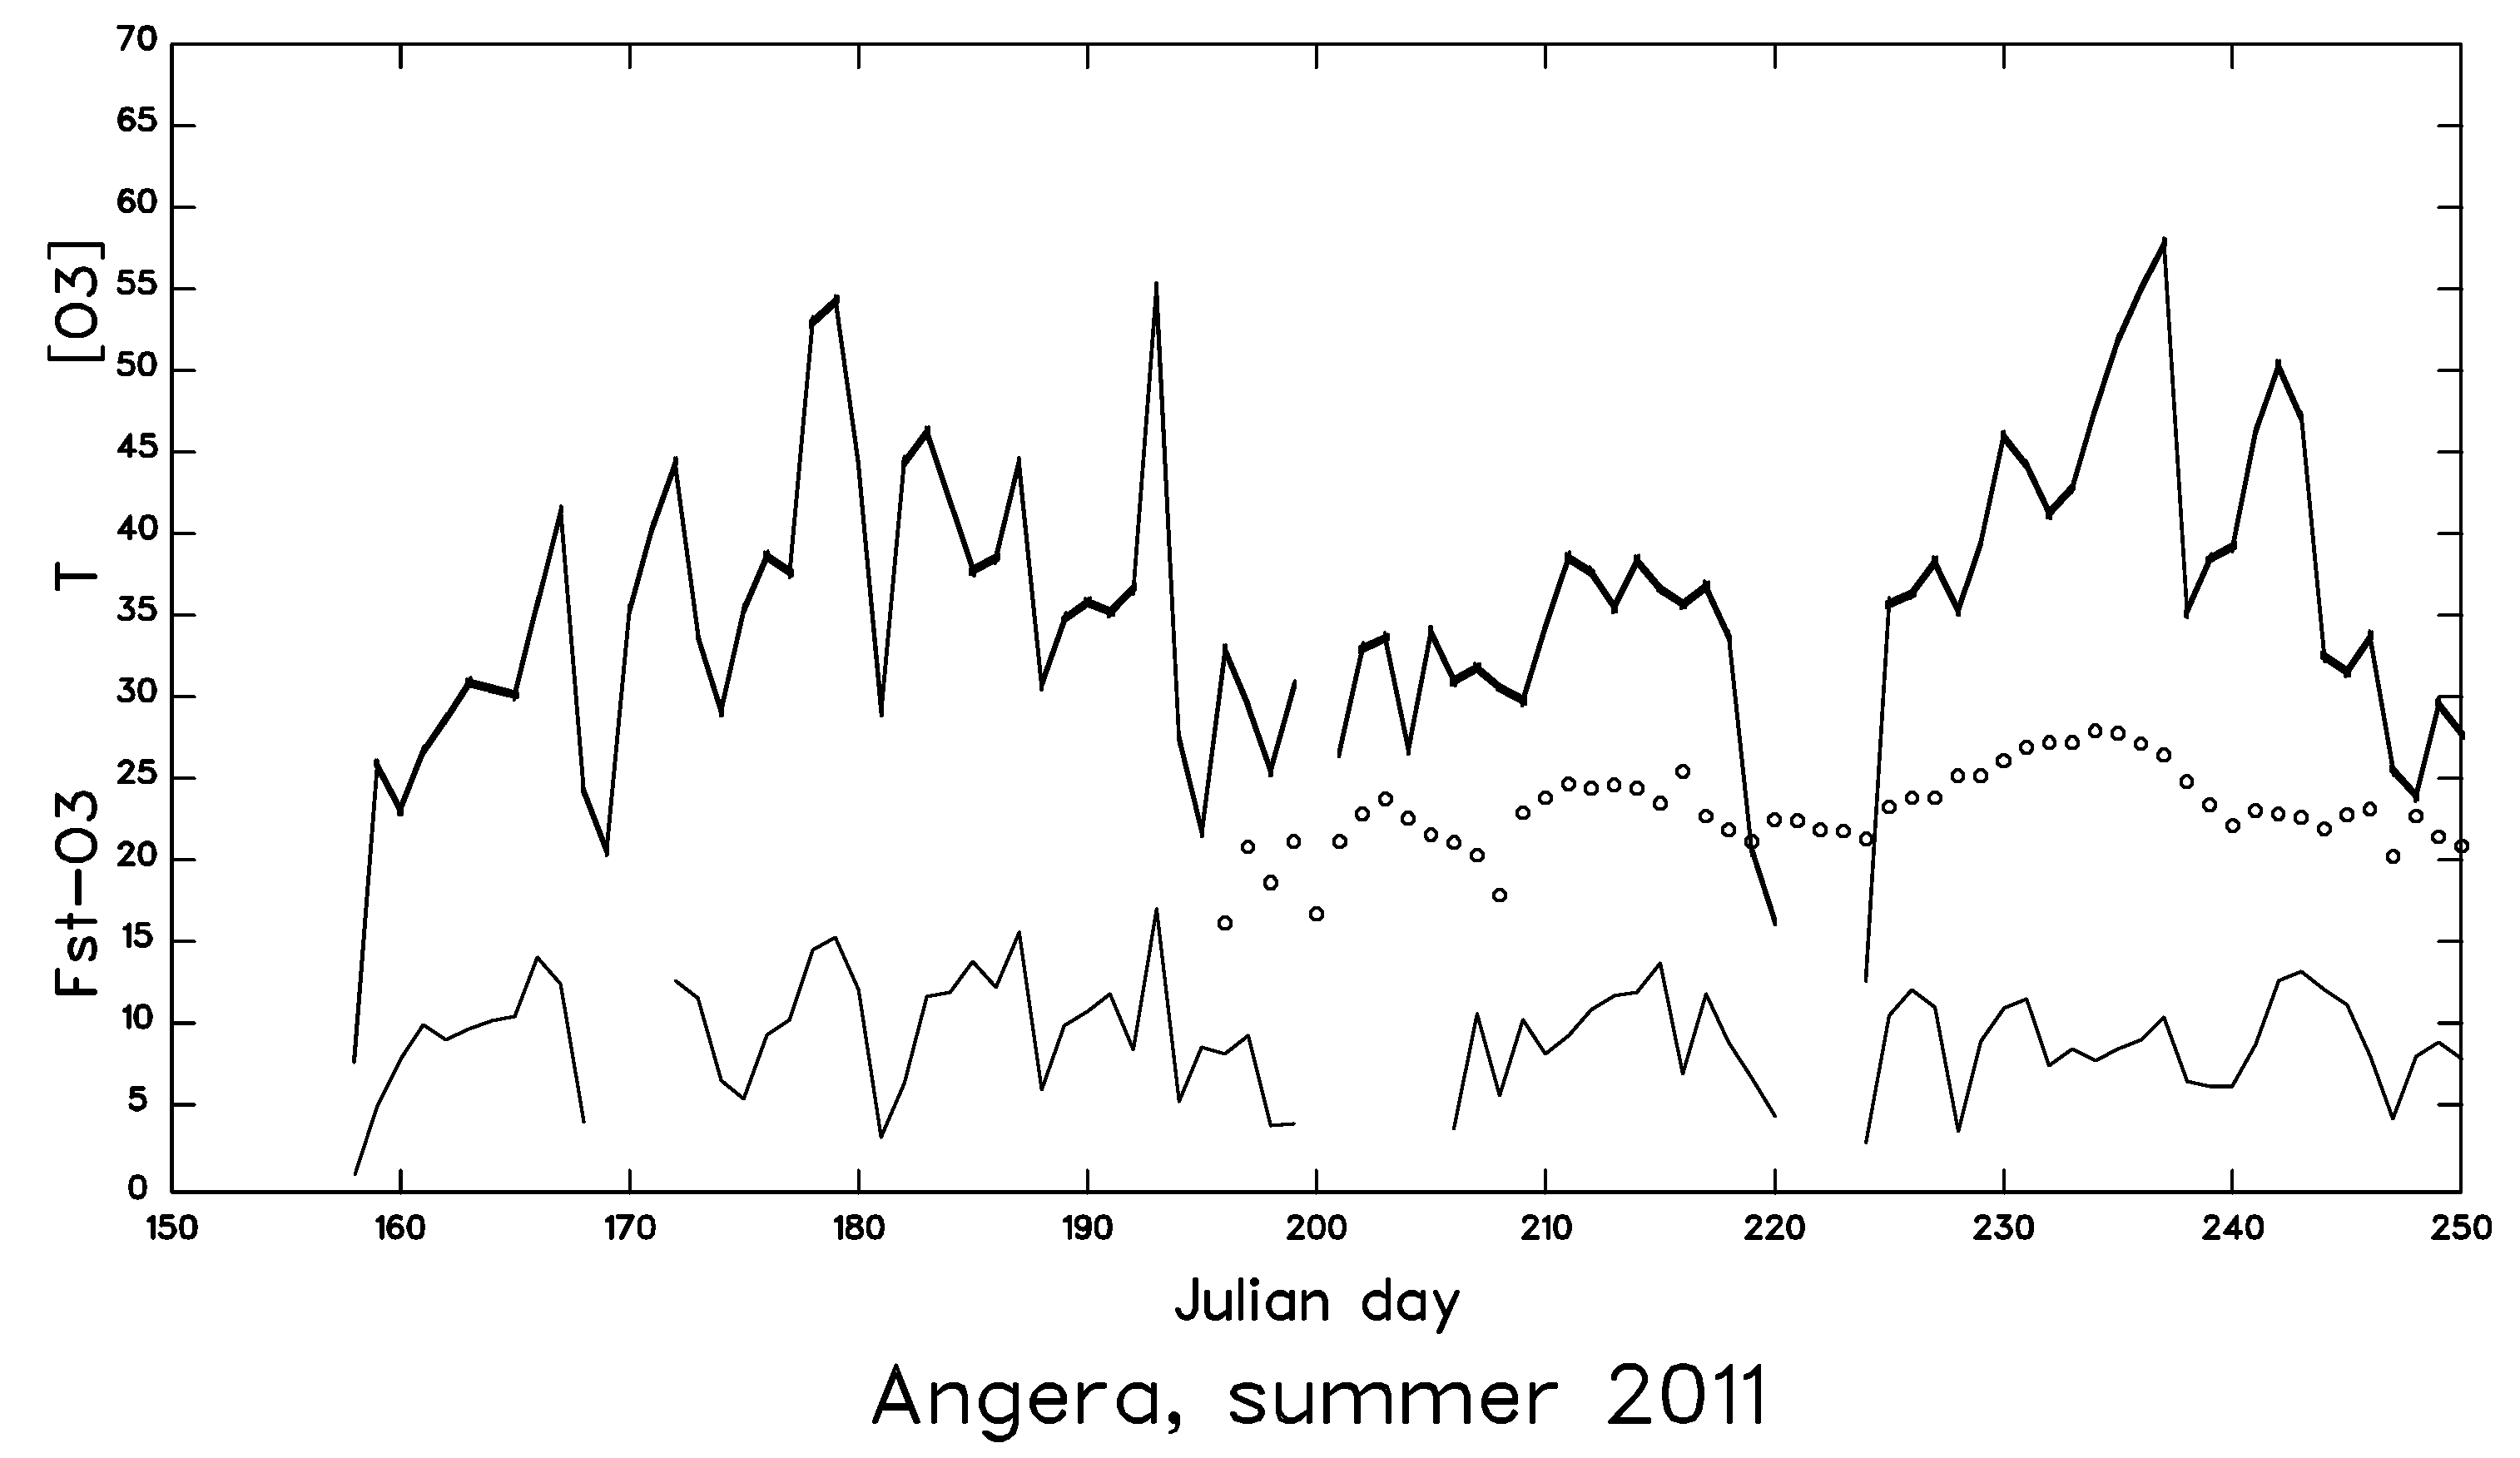
Average trends in O3 concentration, flux, and temperature during the growing season of 2011 are shown in Figure 6. To facilitate the interpretation of these time series, the figure shows daily averages of the variables. A rough correlation appears between ozone concentration and temperature. This reflects the mechanisms of ozone formation, mainly due to photochemical processes, as the mechanisms are triggered by intense solar radiation. Periods of high solar radiation generally occur during summer when temperatures are higher. Stomatal ozone fluxes tend instead to show lower values when the temperature is higher, and, more generally, ozone fluxes and concentrations are not necessarily correlated. High temperatures usually cause stomatal closure, and the daily cycles of these two variables follow different patterns.
By integrating the stomatal fluxes over time from anthesis to harvest, we determined the phytotoxic ozone dose (POD), which expresses the total amount of O3 taken up by the plant (the dose) per unit area across the complete growing season.
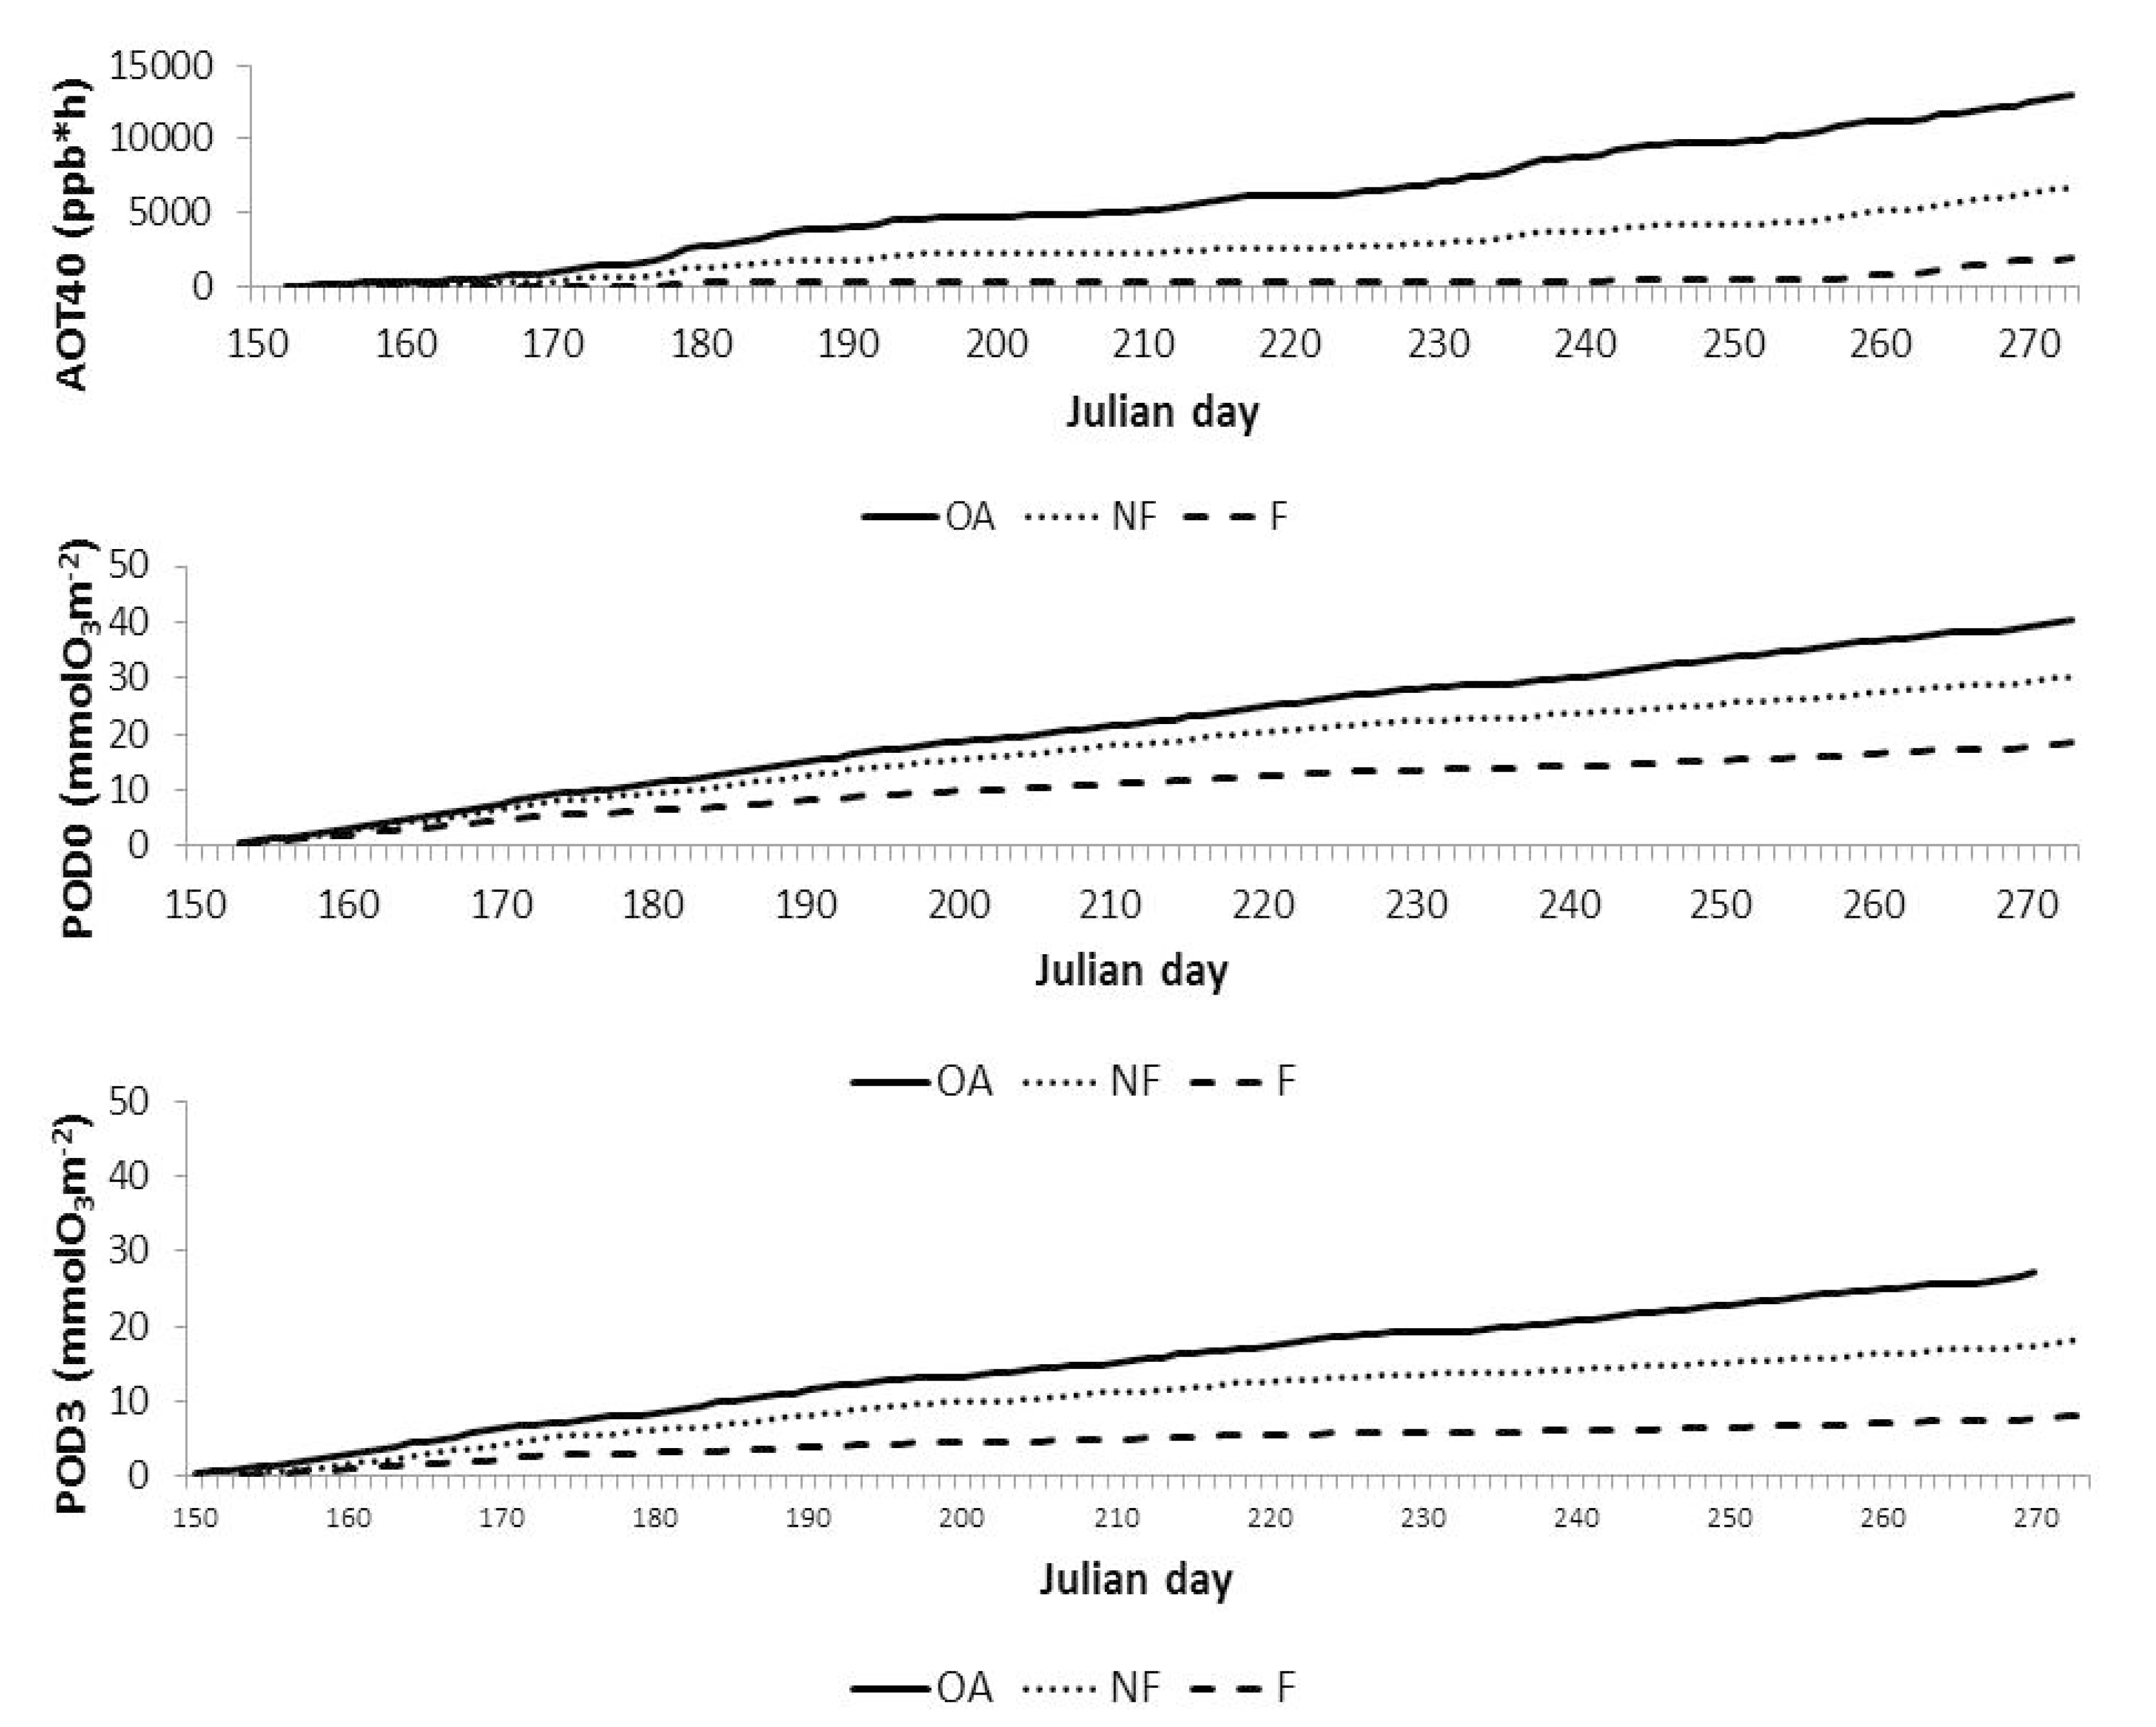
Since the recorded O3 concentration time series was practically uninterrupted from anthesis to harvest, it was possible to determine the exposure indices (AOT40) [30] for the three inlet lines of the ozone measuring system for open air, non-filtered, and filtered OTCs. These values are reported in Table 1. The cumulative curves corresponding to these calculations are shown in Figure 7. A similar calculation was carried out for the stomatal ozone fluxes, which were calculated using the DO3SE model. Here, two thresholds were used: 0 (POD0) and 3 (POD3). Cumulative curves are also represented in Figure 7 and the POD0 values are reported in Table 2.
After harvest, the grapes were analyzed at the Edmund Mach Foundation. Results of these analyses are shown in Table 2, where the results, expressed as averages per treatment, i.e., plants growing externally to the OTCs in open air, in filtered OTCs, and in unfiltered OTCs, respectively, are shown in three columns, with each column corresponding to each treatment.
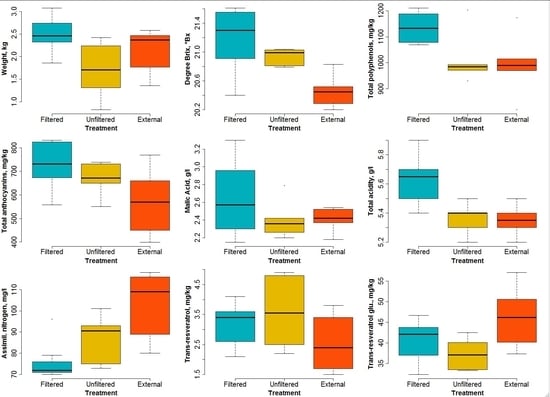
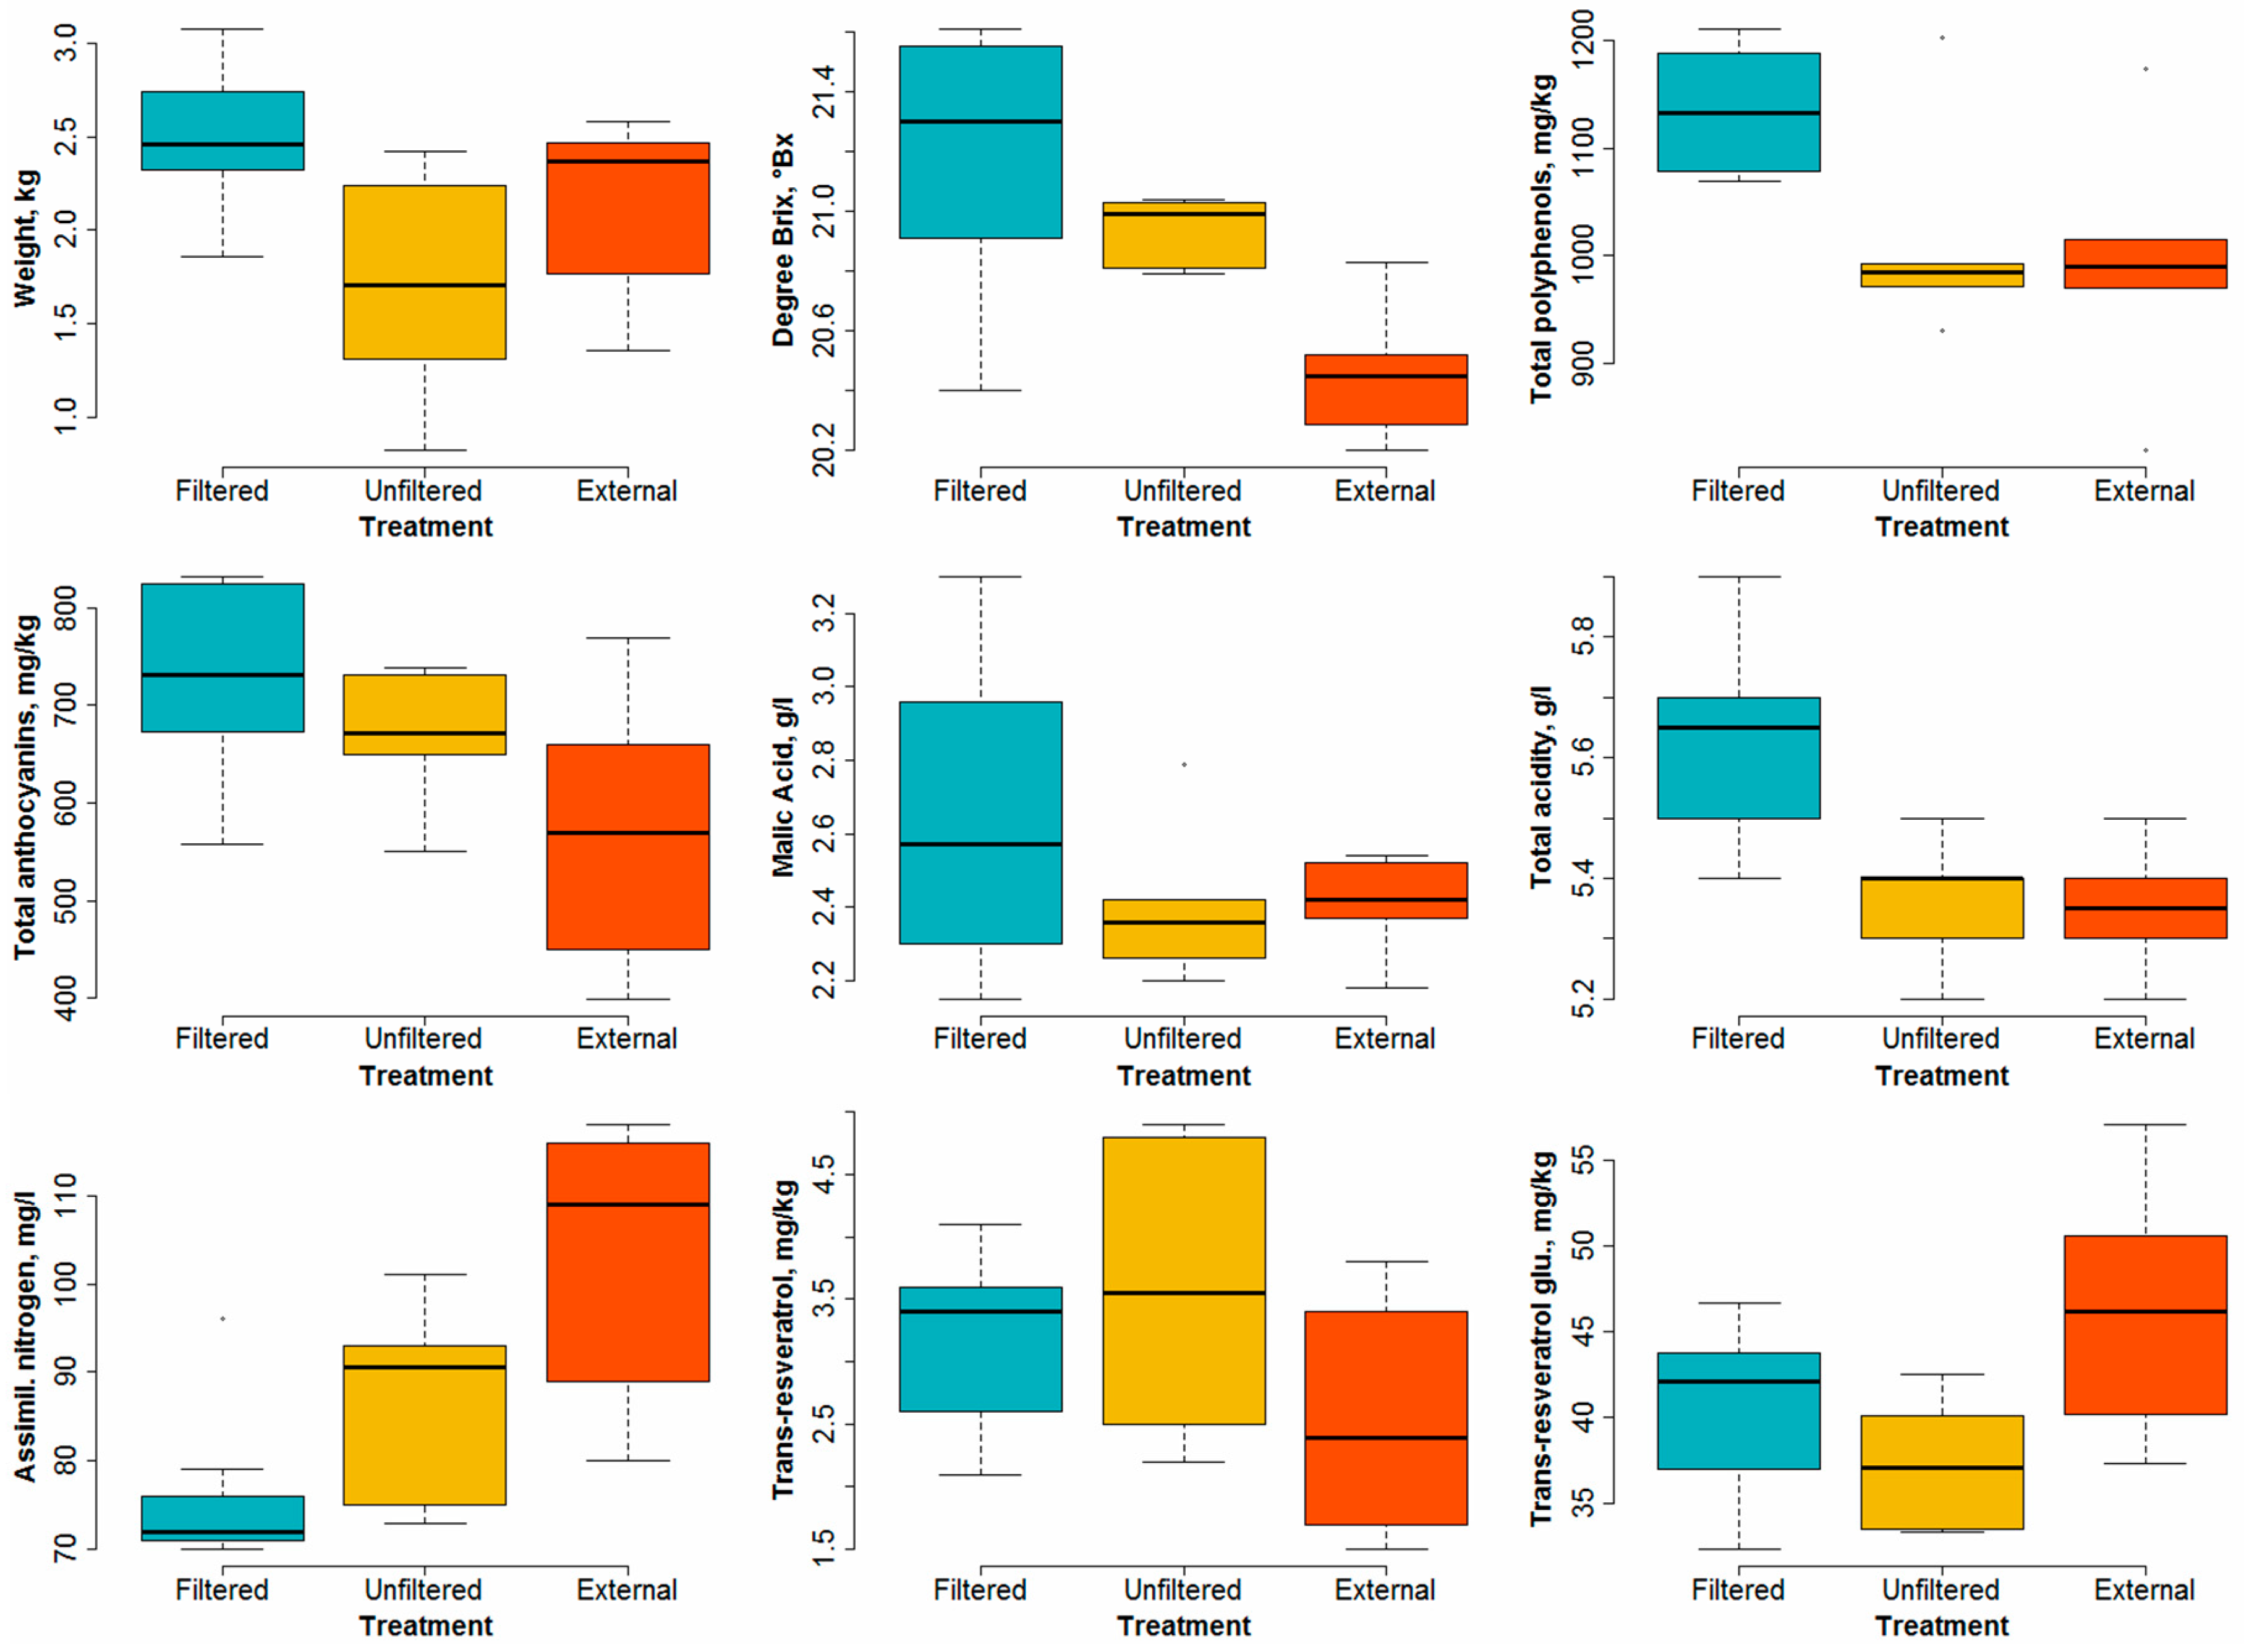
In order to determine the effect of ozone uptake on grapevines, ANOVA was performed on nine out of the fourteen variables appearing in Table 2. We also used the Tukey post-hoc test for multiple comparisons between pairs of treatments. The results of this procedure have been visualized by the box plots shown in Figure 8. Each graph shows, for the variable under consideration, three rectangles which correspond to the three treatments: filtered OTCs, unfiltered OTCs, and external treatment (open air). The horizontal bar present in each rectangle represents the median value (the 50th percentile, i.e., not the mean value, which is shown in Table 2). The vertical extensions of the rectangles represent the lower and upper quartiles (25th and 75th percentiles, respectively). The vertical bars crossing the rectangles represent the minimum and maximum values of the samples. For each variable, the p values were calculated for the three treatments together, as well for pairs of two treatments (filtered-external, unfiltered-external, and unfiltered-filtered), in order to detect significant differences, using the Tukey test. If the p values were less than 0.05, differences were considered significant. We now examine how each of these variables reacted.
- Grape weight per bunch. There is a significant difference between the samples obtained from the filtered OTCs and from the other two treatments (p = 0.0213). However, the p value corresponding to the unfiltered versus external couple is too high (0.22) to imply any significance. Notwithstanding the difference in ozone levels between the unfiltered and external treatments, little difference in the bunch weights is detectable. This is probably due to an effect of the open top chambers in which the physical conditions were not the same as in the open air (i.e., for the external samples). However, significant differences between the weight of the bunches enclosed in the filtered and unfiltered OTCs are clearly visible (see Figure 8), with p = 0.0166. This result shows that higher ozone levels cause a reduction in yields, at least in the case of our experiment.
- Degrees Brix. This variable expresses the sugar content of the must and is widely used in the wine production industry. A rather important effect of ozone levels appears (see Figure 8), especially between samples enclosed in filtered OTCs and external samples (p = 0.0022). The difference is less clear between filtered and unfiltered samples.
- Polyphenols. Here, no clear difference appears between unfiltered and external samples, but the samples enclosed in filtered OTCs are characterized by a much higher content of polyphenols (p = 0.045). These substances are known as antioxidants and have health effects on digestion, for example. The results presented here indicate that high ozone content in air can counterbalance the health effects of polyphenols present in wine.
- Anthocyanins. These pigments present in grapes show a significant difference (p = 0.046) between plants enclosed in filtered OTCs and external ones.
- Malic acid. No significant difference was found between the three treatments due to the overlap of variability ranges for the different treatments. All p values lie above 0.2.
- Titrable acidity. Differences appear rather clearly between plants enclosed in filtered and unfiltered OTCs (p = 0.0086) and between those enclosed in filtered OTCs and under external conditions (p = 0.0055).
- Assimilable nitrogen. Here, an opposite pattern with respect to most other variables can be seen: higher ozone levels result in higher assimilable nitrogen. The variance analysis for all three treatments combined shows good significance (p = 0.0032); the highest significance appears between the external plants and those enclosed in filtered OTCs (p = 0.00067).
- Trans-resveratrol. As for malic acid, no significant difference was found between the three treatments. All p values lie above 0.1.
- Trans-resveratrol glucoside. A significant difference (p = 0.033) appears between external plants and those enclosed in unfiltered OTCs. However, for this variable, no conclusion can be drawn about the effect of ozone between filtered and unfiltered OTCs.
4. Discussion and Conclusions
The effect of atmospheric O3 on Vitis vinifera has been known for a long time [2] as far as foliar injury and some other physiological parameters are concerned. No direct quantitative observations of parameters like crop yield and relevant chemical variables that influence the quantity and quality of the final product, i.e., wine, have been available to date. The present work aimed to constitute a step forward towards fill this knowledge gap by using the open top chamber technique, in which grapevine plants are grown under controlled O3 concentrations. The results show that higher O3 concentrations cause decreases in crop yield, expressed as the weights of grapevine bunches. In addition, the concentrations of several chemical substances present in the must, which influence the quality of the wine produced and are subject to changes in the case of high tropospheric ozone levels. These substances are polyphenols and saccharose (expressed as degrees Brix). Anthocyanins and total acidity are affected as well.
If we exclude the measurements made in 2010, which were just intended as a test of the facility, the present study was carried out over just one season of grapevine growth and was focused on a limited amount of plant material. Still, the results of the present study show that adverse effects can be observed when grapevine plants are exposed to high ozone levels. While this work can be considered as a step forward, further studies are needed for a more comprehensive picture. It was found that exposures to high O3 concentrations reduced the quantities of grapes harvested, resulting in wine production losses. In addition, high O3 levels also affected the quality of the final product. The polyphenol content was also reduced in the case of high O3 levels. These substances have beneficial properties for human health. However, other parameters such as pH and density seemed unaffected. On examining Figure 8, the effect of O3 uptake by vine plants still appears for several variables.
Owing to the economic importance of wine production and quality, it is recommended that full-scale experiments be conducted in particular by focusing on longer exposure periods and a higher amount of plant material. They would need to be coupled with direct measurements of ozone flux, e.g., by using eddy covariance techniques to directly measure ozone fluxes.
Author Contributions
I.F. and S.C. organised and carried out the field experiment; They also participated in the analysis of the results; E.P. made a conceptual work in designing the experiment; C.P. and A.D.M. participated in the modeling and analysis of the data.
Funding
No funding external to the participating institutes was made.
Acknowledgments
The authors are indebted to the Edmund Mach Institute, S. Michele all’Adige, Italy, for having carried out the chemical and gravimetrical analyses of the grapevine bunches harvested after the experiment. The authors thank Michel Gerboles for his valuable assistance in the statistical treatment of the results.
Conflicts of Interest
The authors declare no conflict of interest.
References
- Popescu, S.M. The combined effects of CO2 and O3 on the physiology of the grapevine Vitis vinifera L. cv. Merlot). J. Hortic. For. Biotechnol. 2011, 15, 62–66. [Google Scholar]
- Richards, B.L.; Middleton, J.T.; Hewitt, W.B. Ozone stipple of grape leaf lesions on the upper leaf surfaces and premature leaf fall occur on grapevines in areas polluted by air-borne ozone. Calif. Agric. 1959, 13, 4–11. [Google Scholar]
- Roper, T.R.; Williams, L.E. Effects of ambient and acute partial pressures of ozone on leaf net CO2 assimilation of field-grown Vitis vinifera L. Plant Physiol. 1989, 91, 1501–1506. [Google Scholar] [CrossRef] [PubMed] [Green Version]
- Shertz, R.D.; Kender, W.D.; Musselman, R.D. Effects of ozone and sulfur dioxide on grapevines. Sci. Hortic. 1980, 13, 37–45. [Google Scholar] [CrossRef]
- Soja, G.; Eid, M.; Gangl, H.; Redl, H. Ozone sensitivity of grapevine (Vitis vinifera L.): Evidence for a memory effect in a perennial crop plant. Phyton 1997, 37, 265–270. [Google Scholar]
- Fumagalli, I.; Gimeno, B.S.; Velissariou, D. Evidence of ozone-induced adverse effects on crops in the Mediterranean region. Atmos. Environ. 2001, 35, 2583–2587. [Google Scholar] [CrossRef]
- Velissariou, D.; Gimeno, B.S.; Badiani, M.; Fumagalli, I.; Davison, A.W. Records of O3 visible injury in the ECE Mediterranean region. In Critical Levels for Ozone in Europe: Testing and Finalising the Concept; Karelampi, L., Skarby, L., Eds.; UN-ECE Workshop Report; University of Kuopio: Kuopio, Finland, 1996; pp. 343–350. [Google Scholar]
- Fuhrer, J.; Egger, A.; Lehnherr, B.; Grandjean, A.; Tschannen, W. Effects of ozone on the yield of spring wheat grown in open-top field chambers. Environ. Pollut. 1989, 60, 273–289. [Google Scholar] [CrossRef]
- Oksanen, E.; Freiwald, V.; Prozherina, N.; Rousi, M. Photosynthesis of birch is sensitive to springtime frost and ozone. Can. J. For. Res. 2005, 35, 703–712. [Google Scholar] [CrossRef]
- Soja, G.; Reichenauer, T.G.; Eid, M.; Soja, A.M.; Schaber, R.; Gangl, H. Long-term ozone exposure and ozone uptake of grapevines in open-top chambers. Atmos. Environ. 2004, 38, 2313–2321. [Google Scholar] [CrossRef]
- Lea, M.C. On the influence of ozone and some other chemical agents on germination and vegetation. Am. J. Sci. Arts 1864, 37, 373–376. [Google Scholar] [CrossRef]
- Rich, S.; Waggoner, P.E.; Tomlinson, H. Ozone uptake by bean leaves. Science 1970, 169, 79. [Google Scholar] [CrossRef] [PubMed]
- Turner, N.C.; Waggoner, P.E.; Rich, S. Removal of ozone from the atmosphere by soil and vegetation. Nature 1974, 250, 486. [Google Scholar] [CrossRef]
- Ashmore, M.R. Assessing the future global impacts of ozone on vegetation. Plant Cell Environ. 2005, 28, 949–964. [Google Scholar] [CrossRef]
- Krupa, S.V.; Manning, W.J. Atmospheric ozone: Formation and effects on vegetation. Environ. Pollut. 1988, 50, 101–137. [Google Scholar] [CrossRef]
- Grimes, H.D.; Perkins, K.K.; Boss, W.F. Ozone degrades into hydroxyl radical under physiological conditions. Plant Physiol. 1983, 72, 1016–1020. [Google Scholar] [CrossRef] [Green Version]
- Pryor, W.A.; Church, D.F. Aldehydes, hydrogen peroxide and organic radicals, as mediators of ozone toxicity. Free Rad. Biol. Med. 1991, 11, 41–46. [Google Scholar] [CrossRef]
- Byvoet, P.; Balis, J.U.; Shelley, S.A.; Montgomery, M.R.; Barrber, M.J. Detection of hydroxyl radicals upon interaction of ozone with aqueous media of extracellular surfactants. Arch. Biochem. Biophys. 1995, 319, 464–469. [Google Scholar] [CrossRef]
- Pell, E.J.; Schangnhaufer, C.D.; Arteca, R.N. Ozone-induced oxidative stress: Mechanisms of action and reaction. Physiol. Plant. 1997, 100, 264–273. [Google Scholar] [CrossRef]
- Anjum, N.A.; Umar, S.; Chan, M.T. (Eds.) Ascorbate-Glutathione Pathway and Stress Tolerance in Plants; Springer: Dordrecht, The Netherlands, 2010; ISBN 978-90-481-9403-2. [Google Scholar]
- Tai, A.P.K.; San Martin, M. Impacts of ozone pollution and temperature extremes on crop yields: Spatial variability, adaptation and implications for future food security. Atmos. Environ. 2017, 169, 11–21. [Google Scholar] [CrossRef]
- Van Dingenen, R.; Dentener, F.J.; Raes, F.; Krol, M.C.; Emberson, L.; Cofala, J. The global impact of ozone on agricultural crop yields under current and future air quality legislation. Atmos. Environ. 2009, 43, 604–618. [Google Scholar] [CrossRef]
- Sitch, S.; Cox, P.M.; Collins, W.J.; Huntingford, C. Indirect forcing of climate change through ozone effects on the land-carbon sink. Nature 2007, 448, 791–794. [Google Scholar] [CrossRef] [PubMed]
- Cieslik, S.; Tuovinen, J.P.; Baumgarten, M.; Matyssek, R.; Brito, P.; Wieser, G. Gaseous exchange between forests and the atmosphere. In Climate Change, Air Pollution and Global Challenges; Matyssek, R., Clarke, N., Cudlin, P., Mikkelsen, T.N., Tuovinen, J.P., Wieser, G., Paoletti, E., Eds.; Elsevier: Amsterdam, The Netherlands, 2013; part 2. [Google Scholar]
- Franz, M.; Alonso, R.; Arneth, A.; Zaehle, S. Evaluation of simulated ozone effects in forest ecosystems against biomass damage estimates from fumigation experiments. Biogeosciences 2018, 15, 6941–6957. [Google Scholar] [CrossRef] [Green Version]
- Mills, G.; Pleijel, H.; Malley, C.S.; Sinha, B.; Cooper, O.R.; Scholtz, C.S.; Neufeld, H.S.; Simpson, D.; Sharops, K.; Feng, Z.; et al. Tropospheric ozone assessment report: Present-day tropospheric ozone distribution and trends relevant to vegetation. Elementa 2018, 6, 47. [Google Scholar] [CrossRef]
- Niinemets, Ü. Responses, of forest trees to single and multiple environmental stresses from seedlings to mature plants. For. Ecol. Manag. 2010, 260, 1623–1639. [Google Scholar] [CrossRef]
- Directive 2008/50/EC of the European Parliament and of the Council. Off. J. Eur. Communities 2008, 11, 2008.
- Grünhage, L.; Jäger, H.J. From critical levels to critical loads for ozone: A discussion of a new experimental and modelling approach for establishing flux-response relationships for agricultural crops and native plant species. Environ. Pollut. 2003, 125, 99–110. [Google Scholar] [CrossRef]
- Kärenlampi, L.; Skärby, L. (Eds.) Critical Levels for Ozone in Europe: Testing and Finalizing the Concepts; UN-ECE Workshop Report; University of Kuopio: Kuopio, Finland, 1996. [Google Scholar]
- Paoletti, E.; Manning, W.J. Toward a biologically significant and usable standard for ozone that will also protect plants. Environ. Pollut. 2007, 150, 85–95. [Google Scholar] [CrossRef]
- Emberson, L.D.; Wieser, G.; Ashmore, M.R. Modelling of stomatal conductance and ozone flux of Norway spruce: Comparison with field data. Environ. Pollut. 2000, 109, 393–402. [Google Scholar] [CrossRef]
- Emberson, L.D.; Ashmore, M.R.; Cambridge, H.M.; Simpson, D.; Tuovinen, J.P. Modelling of stomatal ozone flux across Europe. Environ. Pollut. 2000, 109, 403–413. [Google Scholar] [CrossRef]
- Musselman, R.C.; Lefohn, A.S.; Massman, W.J.; Heath, R.L. A critical review and analysis of the use of exposure- and flux-based ozone indices for predicting vegetation effects. Atmos. Environ. 2006, 40, 1869–1888. [Google Scholar] [CrossRef]
- Alebić-Juretić, A.; Bokan-Vocelić, I.; Mifka, B.; Zatezalo, M.; Zubak, V. Impact of ozone gradient on grapevine leaves. In Proceedings of the 19th EGU General Assembly, Vienna, Austria, 23–28 April 2017; p. 5660. [Google Scholar]
- Xiao, F.; Yang, Z.Q.; Lee, K.W. Photosynthetic and physiological responses to high temperature in grapevine (Vitis vinifera L.) leaves during the seedling stage. J. Hortic. Sci. Biotechnol. 2017, 92, 2–10. [Google Scholar] [CrossRef]
- Valletta, A.; Salvatori, E.; Santamaria, A.R.; Nicoletti, M.; Toniolo, C.; Caboni, E.; Bernardini, A.; Pasqua, G.; Manes, F. Ecophysiological and phytochemical response to ozone of wine grape cultivars of Vitis vinifera L. Nat. Prod. Res. 2016, 30, 2514–2522. [Google Scholar] [CrossRef] [PubMed]
- Mattivi, F. La stima della maturazione fenolica delle uve rosse con un nuovo metodo rapido. ENOLOGO-MILANO- 2007, 43, 89. [Google Scholar]
- Gatto, P.; Vrhovsek, U.; Muth, J.; Segala, C.; Romualdi, C.; Fontana, P.; Pruefer, D.; Stefanini, M.; Moser, C.; Mattivi, F.; et al. Ripening and genotype controlled stilbene accumulation in healthy grapes. J. Agric. Food Chem. 2008, 56, 11773–11785. [Google Scholar] [CrossRef] [PubMed]
Figure 1.
View of two of the four open top chambers enclosing grapevine plants on the chosen vineyard in Angera. The chambers were fed with air which was ambient or charcoal-filtered.
Figure 1.
View of two of the four open top chambers enclosing grapevine plants on the chosen vineyard in Angera. The chambers were fed with air which was ambient or charcoal-filtered.

Figure 2.
Ozone concentrations measured inside and outside the open top chambers enclosing grapevines at the vineyard in Angera. Measurements were carried out from 5 to 10 August 2010 without any filtering in order to check whether the outputs obtained with the three lines agreed with each other. No significant difference appeared.

Figure 3.
Ozone concentrations measured inside and outside the open top chambers (OTCs) during August 2010 at the vineyard in Angera. Here, filtering was active. The bold line refers to the filtered OTC, the thin line to the unfiltered OTC, and the circles to the open air.
Figure 3.
Ozone concentrations measured inside and outside the open top chambers (OTCs) during August 2010 at the vineyard in Angera. Here, filtering was active. The bold line refers to the filtered OTC, the thin line to the unfiltered OTC, and the circles to the open air.

Figure 4.
Time series of daily averaged temperature (upper frame) and relative humidity (lower frame) during the 2011 experiment. No significant differences between the three cases (open air (OA), filtered OTC (F) and unfiltered OTC (NF)) can be noted.
Figure 4.
Time series of daily averaged temperature (upper frame) and relative humidity (lower frame) during the 2011 experiment. No significant differences between the three cases (open air (OA), filtered OTC (F) and unfiltered OTC (NF)) can be noted.

Figure 5.
Time series of data recorded at the Angera OTC site from 25 to 31 July 2011. The rows from top to bottom are for ambient temperature, ambient relative humidity, stomatal ozone fluxes calculated using the DO3SE model (Deposition of Ozone for Stomatal Exchange), and ozone concentrations. For the two lowest rows, the circles represent data for outside the OTCs, the thin solid line corresponds to data for the unfiltered OTCs, and the bold line corresponds to data for the filtered OTCs.

Figure 6.
Daily averaged ozone concentrations ([O3]) (ppb, bold line), open air temperatures (T) (°C, circles), and stomatal ozone fluxes (Fst-O3) (nmol m2 s−1, thin solid line) at the Angera vineyard from June to September 2011.
Figure 6.
Daily averaged ozone concentrations ([O3]) (ppb, bold line), open air temperatures (T) (°C, circles), and stomatal ozone fluxes (Fst-O3) (nmol m2 s−1, thin solid line) at the Angera vineyard from June to September 2011.

Figure 7.
Ozone exposure index (AOT40) (upper frame), phytotoxic ozone dose without threshold (POD0) (middle frame), and phytotoxic ozone dose with threshold (POD3) (lower frame); the data are presented as progressively accumulated over the period of the experiment under the three experimental conditions.

Figure 8.
Box plots representing the behavior of nine variables characterizing the grapevines’ responses when subject to three treatments: filtered and unfiltered OTCs and external (open air) conditions. The first variable is the weight per bunch; all other variables are chemical variables.
Figure 8.
Box plots representing the behavior of nine variables characterizing the grapevines’ responses when subject to three treatments: filtered and unfiltered OTCs and external (open air) conditions. The first variable is the weight per bunch; all other variables are chemical variables.


Table 1.
Values of the AOT40 and POD0 indices calculated for summer 2011.
| AOT40 (ppb.h) | POD0 (mmol.m−2) | |
|---|---|---|
| External | 12,300 | 38.1 |
| Unfiltered OTC | 6100 | 32.0 |
| Filtered OTC | 2000 | 21.4 |
Table 2.
Results of analyses made on Angera grapevine bunches for summer 2011. The values are averages over all bunches cut from plants corresponding to the different treatments; the standard deviations (sigma) are also represented. Analyses were carried out at the Edmund Mach Foundation.
Table 2.
Results of analyses made on Angera grapevine bunches for summer 2011. The values are averages over all bunches cut from plants corresponding to the different treatments; the standard deviations (sigma) are also represented. Analyses were carried out at the Edmund Mach Foundation.
| External | Filtered OTC | Unfiltered OTC | |
|---|---|---|---|
| Grape weight per bunch (kg) | 2.14 ± 0.45 | 2.50 ± 0.37 | 1.72 ± 0.54 |
| Degrees Brix (°Bx) | 20.62 ± 0.35 | 21.18 ± 0.42 | 20.94 ± 0.11 |
| pH | 3.32 ± 0.0 | 3.32 ± 0.1 | 3.35 ± 0.0 |
| Titrable acidity (as tartaric acid, g/L) | 5.35 ± 0.1 | 5.56 ± 0.2 | 5.37 ± 0.1 |
| Density at 20 °C | 1.090 ± 0.0 | 1.092 ± 0.0 | 1.091 ± 0.0 |
| Tartaric acid (g/L) | 6.25 ± 0.1 | 6.19 ± 0.3 | 6.15 ± 0.1 |
| Malic acid (g/L) | 2.41 ± 0.12 | 2.65 ± 0.40 | 2.40 ± 0.10 |
| Potassium (mg/L) | 1705 ± 27.9 | 1745 ± 69.8 | 1689 ± 37.2 |
| Assimilable nitrogen (mg/L) | 103.5 ± 14.3 | 76.0 ± 8.6 | 87.1 ± 10.0 |
| Total anthocyanins (mg/kg) | 569.3 ± 131.3 | 731.0 ± 98.8 | 668.7 ± 62.8 |
| Total polyphenols (mg/kg) | 992 ± 103 | 1141 ± 53 | 972 ± 22 |
| Trans-resveratrol (mg/kg) | 2.5 ± 0.8 | 3.1 ± 0.7 | 3.6 ± 1.1 |
| Cis-resveratrol glucoside (mg/kg) | <0.1 | <0.1 | <0.1 |
| Trans-resveratrol glucoside (mg/kg) | 46.3 ± 6.7 | 40.4 ± 0.7 | 37.3 ± 3.7 |
© 2019 by the authors. Licensee MDPI, Basel, Switzerland. This article is an open access article distributed under the terms and conditions of the Creative Commons Attribution (CC BY) license (http://creativecommons.org/licenses/by/4.0/).
Share and Cite
MDPI and ACS Style
Fumagalli, I.; Cieslik, S.; De Marco, A.; Proietti, C.; Paoletti, E. Grapevine and Ozone: Uptake and Effects. Climate 2019, 7, 140. https://doi.org/10.3390/cli7120140
AMA Style
Fumagalli I, Cieslik S, De Marco A, Proietti C, Paoletti E. Grapevine and Ozone: Uptake and Effects. Climate. 2019; 7(12):140. https://doi.org/10.3390/cli7120140
Chicago/Turabian StyleFumagalli, Ivano, Stanislaw Cieslik, Alessandra De Marco, Chiara Proietti, and Elena Paoletti. 2019. "Grapevine and Ozone: Uptake and Effects" Climate 7, no. 12: 140. https://doi.org/10.3390/cli7120140
Note that from the first issue of 2016, this journal uses article numbers instead of page numbers. See further details here.